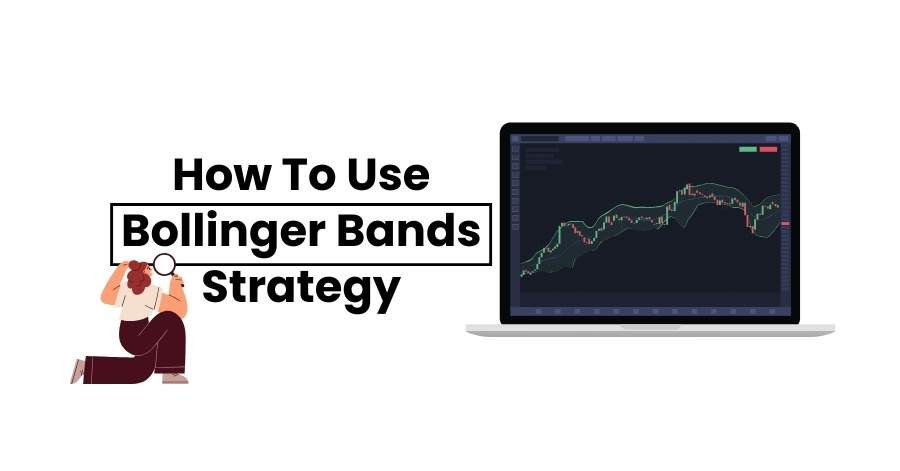
The love of traders for technical analysis tools and indicators is evident. Trading is all about predicting the rise and fall in the prices of financial instruments, and indicators enable traders to do so. Even beginners or novice traders can place trades using these tools. In this article, we learn about a popular indicator, Bollinger Bands strategy, and how to implement it.
Introduction to Bollinger bands
Bollinger Bands is a popular technical analysis indicator developed by John Bollinger in the 1980s. It is used to measure valuable market insight, including volatility, breakouts, price reversals, entry, exit overbought, and oversold conditions.
Traders can use this powerful indicator for trading in forex, cryptocurrencies, stocks, indices, commodities, and futures.
The concept of Bollinger bands
Bollinger Bands indicators consist of three bands. All the three Bollinger lines have different significance. Before moving to how to interpret this indicator, let us have a look at some important terms.
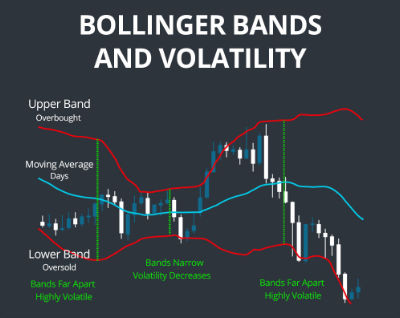
There are three bands in bollinger: Upper, lower, and middle. The middle band represents the simple moving average of a particular range while the upper and lower band represents the standard deviation of the data set.
It is an arithmetic calculation that plays a vital role in Bollinger bands interpretation. Under this, the mean of moving price level over a period or range is calculated. The range can be of the last 20, 100, or 200 days.
Variance:
It is the dispersion or spread of the data set. Variance is calculated by subtracting each data set from the mean.
Standard Deviation:
It is the measure to calculate the dispersion or variation of a data set over a particular range or period relative to its mean. It is the square root of variance.
Middle Band:
The middle band is the most crucial element of Bollinger Bands strategy. It represents the simple moving average of a range of trading days or periods. In the financial market, it represents the trend line in a chart over a period.
Generally, for Bollinger bands, forex brokersuse the time frame of the last 20 days. However, you can set the time frame based on your strategy.
Upper Band:
The upper band represents the standard deviation above the simple moving average.
Lower Band:
The lower band represents the standard deviation below the simple moving average.
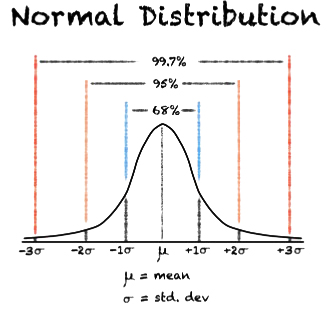
When these upper and lower bands are one standard deviation, it represents that 68% of price movement has occurred within these bands. Meanwhile, when these bands are two standard deviations, it suggests that 95% of price movement has occurred within these bands.
How to use Bollinger Bands strategy
We have understood the basics of this indicator. Now, the question is how to read Bollinger bands and interpret the market conditions. You can use the indicator for different purposes. Let us understand how to implement this strategy effectively and make maximum money in the market.
Volatility Determination:
Volatility represents the degree of price fluctuation of a currency pair over a period. It plays a crucial role in selecting the right instrument pair at the right time. Generally, traders trade in low-volatile currency pairs as highly volatile pairs are quite risky and unpredictable. You can measure the volatility of currency pairs using Bollinger bands.
When the distance between the upper band and lower band widens, it indicates high volatility; meanwhile, when the bands contract, it indicates low volatility.
The key rule for using the Bollinger bands is patience. We have discussed above how to interpret the indicators and place trade. But a trader should understand that there is no hard and fast or specific rule in trading.
Not every touch is an indication for placing a trade. Many traders make the silly mistake of placing a trade on every touch. However, the right way is to wait and confirm the finding with other indicators and a candlestick chart.
Trend Identification:
You can identify the primary and secondary trends using this indicator. When the price moves toward the upper band, it indicates the uptrend, and when the price moves persistently toward the lower band, it indicates the downtrend.
Overbought and Oversold conditions:
One of the major uses of Bollinger bands is to identify overbought and oversold conditions. Overbought is when the price of an asset rises so much that a reversal is expected. Oversold is when the asset’s price falls too much that a pullback or bounce is expected. When the price of the asset touches the upper band of the Bollinger band, it indicates overbought, suggesting traders take a short position. Meanwhile, when the price touches the lower band, it indicates oversold, suggesting traders take a long position.
Squeeze Patterns:
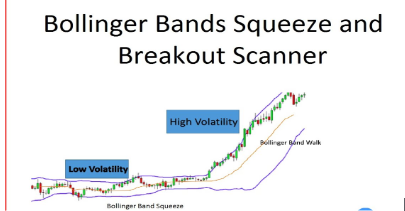
A squeeze is a pattern formed when the distance between the lower and upper bands narrows or starts moving sideways in a tight consolidation, suggesting a breakout is going to happen. You can easily identify squeezes in charts when the asset is moving in a low volatility range. Under this condition, generally, the price started moving aggressively in either direction after the period of consolidation.
Pivot Point Identification:
Bollinger bands can be used to determine the pivot points for trade execution. Many people use the price level of lower and upper bands as the support and resistance points.
In addition, many traders also use this indicator to set the stop loss and take profit points. Suppose a person wants to open a long position; then he can use the upper band as the take profit level and the lower band as the stop loss level.
Tips for using Bollinger Bands strategy
Using Bollinger bands in trading is like an art, and it requires some skills. Also, if not done effectively, one can suffer from huge losses. Let us have a look at some tips for using the tools in the right way.
Learning:
Bollinger Band can be a complex technical analysis indicator for placing a trade but with proper knowledge. So, a trader should first clear his basics. You can refer to the books or our courses to understand its concept. Once you are well versed with the theoretical concept, you can place the trade using this strategy on the demo account for practice. It will help you determine whether you are using the indicator in the right way.
Multiple Confirmation:
Bollinger band is an excellent indicator; however, in trading, there is no foolproof plan. Even when you are trading with the most effective indicators, confirmation is a must. So, a trader should never depend on a single indicator. You can use the relative strength indexand stochastic oscillators to confirm the interpretation of Bollinger bands.
Be aware of false signals:
When you are trading with technical analysis tools, always remember that these indicators may generate false signals. Also, news, economic events, and other fundamental analysis factors can change the whole market scenario. So be aware of these sudden changes and fake signals that may affect the overall return.
Be Patient:
The key rule for using the Bollinger bands is patience. We have discussed above how to interpret the indicators and place trade. But a trader should understand that there is no hard and fast or specific rule in trading.
Not every touch is an indication for placing a trade. Many traders make the silly mistake of placing a trade on every touch. However, the right way is to wait and confirm the finding with other indicators and a candlestick chart.
Wrapping Up
Bollinger Bands strategy is a powerful and widely used strategy to get valuable market insight. You can use this tool for short-term styles like day trading or scalping and for long-term styles like swing trading or position trading by adjusting the Bollinger bands settings.
However, remember the way you use this method may affect the overall result. If you are placing the trade blindly during the overbought and oversold condition, then it may have resulted in significant losses.
An intelligent trader is the one who knows when to place a trade. You need not place a trade on every touch. Remember, all these indicators are based on the historical price pattern and assumptions.
No indicator or person can give you a 100 percent profit guarantee. However, using these indicators effectively will help you to remain in a consistently profitable position.
The best way to use this indicator is confirmation. Always confirm the interpretation with other tools and patterns, and then only put your money in the market.