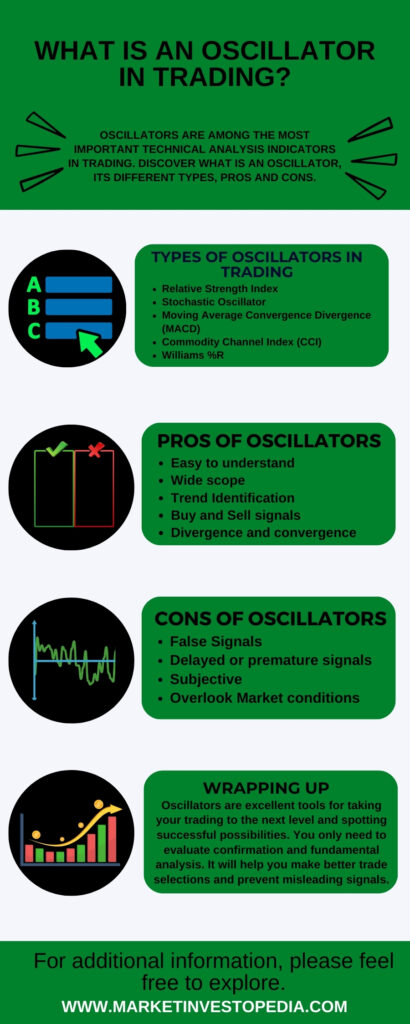
What is an oscillator in trading?
Other Post

Oscillators consist of two bands denoting highs and lows and a central line that oscillates between these bands.
Oscillators are useful mathematical tools used in different industries for different purposes. However, these are amongst the most valuable technical analysis tools in the trading world. In this article, we will have an overview of what is an oscillator, its types, and how to use them in trading.
What is an oscillator in trading?
An oscillator is an indicator that provides valuable market insight regarding the asset price movement based on mathematical formulas and historical data.
Oscillators consist of two bands denoting highs and lows and a central line that oscillates between these bands. The main objective behind using oscillators is to identify potential buying and selling opportunities.
When the price reaches the upper band, it indicates the overbought condition and the asset price is expected to fall. When the price reaches the lower band, it indicates the oversold condition, and the asset price is likely to rise in such cases.
Oscillators may generate effective short-term or long-term trading signals. These are useful when trading currency pairs, cryptocurrencies, commodities, stocks, or other financial instruments.
Types of oscillators in trading
Numerous oscillators are there that provide compelling insight to make the right decision. However, from a trading perspective, here is a list of the top oscillators and how to interpret them:

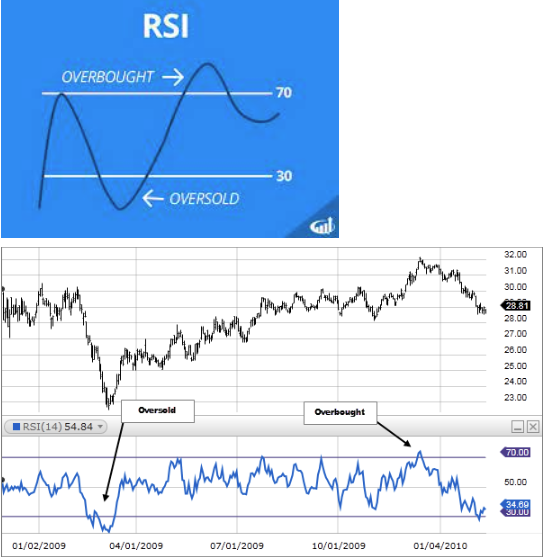
Relative Strength Index:
RSI is considered the best oscillator in trading forex or any other financial product. Under this, the price oscillates from 0 to 100 over 14 days or a specific time frame.
When the price moves above the range of 70, it indicates overbought conditions, suggesting the trader goes short, and when the price moves below the range of 30, it indicates oversold conditions, suggesting the trader goes long.
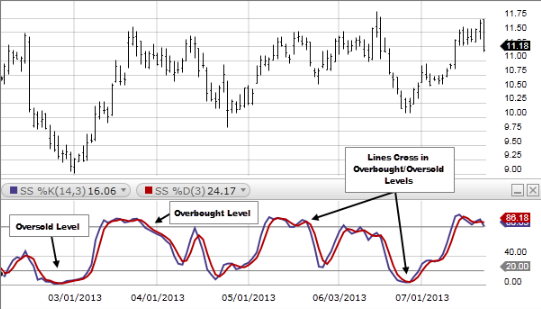
Stochastic Oscillator:
The oscillator was developed by George Lane to provide major insight related to asset price momentum. In the oscillated range of 0 to 100, when a price goes above 80, it indicates an overbought condition, while when a price goes below 20, it indicates an oversold condition.
The stochastic oscillators compare the closing price of an asset with the price range over the period. It is amongst the easiest or simplest to track the overall momentum of the asset over a period.
A quick glance
An Oscillator is a technical analysis indicator oscillating between two bands, denoting highs and lows over a specific period. It provides valuable market insight regarding the asset price movement.
- Relative Strength Index
- Stochastic Oscillator
- Moving Average
- Convergence Divergence (MACD)
- Commodity Channel Index (CCI)
- Williams %R
- Easy to understand
- Wide Applicability
- Trend Identification
- Buy and Sell signals
- Divergence and convergence
- False Signals
- Delayed or premature signals
- Subjective
- Overlook Market conditions
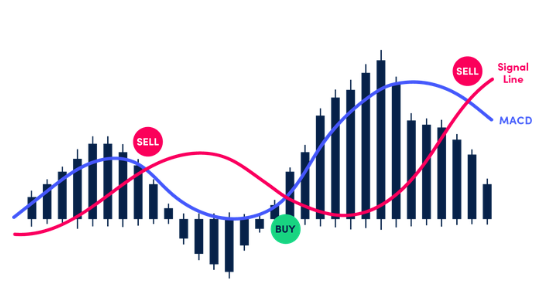
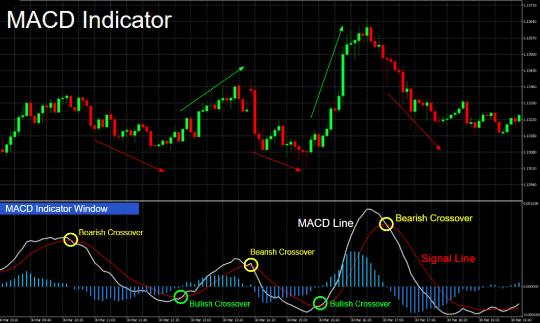
Moving Average Convergence Divergence (MACD):
MACD is a leading indicator to identify overbought, oversold, price divergence, convergence, and other pivot information.
The oscillator considers the difference of the moving average of a short and long period to determine the trend’s strength or weakness. A rising MACD indicates the strength of a trend, while a falling MACD indicates the weakening of the trend.
Commodity Channel Index (CCI):
CCI is a popular indicator for getting valuable trade insights, including trend strength and potential for reversal
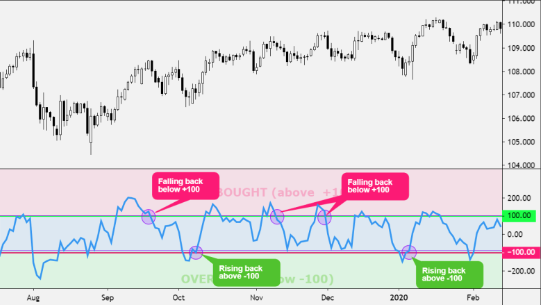
Unlike the other oscillators, CCI is not range bound, and it can go higher and lower the key ranges of -100 and +100.
When the price moves within the range, it indicates indecision; above +100 suggests an overbought condition, indicating a bearish reversal, while below -100 suggests an oversold, indicating a bullish reversal.
Williams %R:
The oscillator is regarded as the William percentage range developed by Larry Williams, which moves between the range 0 to -100. It shows the relationship between the closing price to high and low prices.
It is quite similar to the stochastic oscillator; the lines are also very similar. However, under William % R, a reading above -20 is considered as overbought, while below -80 is considered as oversold.
Pros and Cons of Oscillators in Trading
The discussion of what is an oscillator is incomplete without discussing its advantages and disadvantages. So, for a better understanding of oscillators, let us briefly discuss them:
Pros of oscillators
Easy to understand:
The best part about oscillators is simplicity. Understanding and trading oscillators is relatively easy. Interpreting different oscillators is quite similar to each other. Whether you are a beginner, intermediate or advanced trader, these are user-friendly tools to use.
Wide scope:
Oscillators are mathematical and technical tools that have applicability in different sectors, including medicine, automation, finance, research, manufacturing, etc.
Even in the trading world, oscillators are used for trading in different financial markets, including forex, cryptocurrencies, commodities, stocks and indices.
Trend Identification:
Oscillators are valuable tools for identifying ongoing trends and their strengths or weaknesses over a period. A rising oscillator indicates a strong uptrend, while a falling oscillator indicates a strong downtrend. So, you can make the right trade decision at the right time considering the trend.
Buy and Sell signals:
Another benefit of using oscillators is you can actually identify potential trade opportunities. As we have studied above, oscillators provide overbought and oversold conditions. These conditions can generate valuable buy and sell signals.
Overbought occurs when the asset price rises sharply and reaches a historical level from where it is expected to fall. It means traders can go short. Meanwhile, oversold occurs when the asset price falls sharply and reaches a historical level from where it is expected to rise. It means traders can go short.
Buy and Sell signals:
Oscillators help you in identifying divergence and convergence and trade accordingly. Convergence is a condition when the price and indicator move in the same direction.
Divergence is a condition when the indicator and the price move in the opposite direction. These technical concepts help traders identify the strength or weakness of the trend, trend reversal, and other useful insights.
Cons of oscillators
Timing is the most crucial element for trading oscillators. These indicators can generate premature or delayed signals in choppy market conditions.
False Signals:
In the trading world, nothing is 100% accurate, and even oscillators are not foolproof. It means oscillators can generate false signals, and you can lose a significant amount of money in such cases. Not every signal indicates trade; a trader should understand that.
Delayed or premature signals:
Timing is the most crucial element for trading oscillators. These indicators can generate premature or delayed signals in choppy market conditions.
Also, the effectiveness of signals may vary depending on the accuracy of the tools used. The time frame, confirmation indicator, and overall chosen setting can affect the results.
Subjective:
Every trader in the market comes with a different mindset, and the way of seeing things also depends on experience and knowledge. So, interpreting the oscillator is subjective, which means two traders come up with different conclusions.
Also, the effectiveness of signals may vary depending on the accuracy of the tools used. The time frame, confirmation indicator, and overall chosen setting can affect the results.
Overlook Market conditions:
Depending solely on the oscillator is not a good idea. One should combine it with other technical analysis tools for confirmation. Also, the oscillator does not consider current market conditions, including news, economic events and overall sentiment.
Difference between Oscillators and Indicators
Many people think oscillators and indicators are the same thing. However, that’s not true. All oscillators are indicators, but not all indicators are oscillators.
Oscillators are a type of technical analysis indicator that is quite similar to other indicators. The major difference is that the oscillator fluctuates within a defined range like 0 to 100, -100 to +100, etc.
Oscillators provide traders valuable insights, including overbought, oversold, momentum, trends effectiveness, etc. RSI, CCI, and MACD are among the popular oscillators.
Indicators include a wide range of technical analysis tools, and even oscillators are also indicators. The concept of the indicator is comparatively broad.
Indicators provide traders with broader market insight, including price volatility, trends, momentum, overbought, oversold, support and resistance levels and much more.
Bollinger Bands, Moving averages, Fibonacci retracement, Relative strength index, Stochastic Oscillator, and numerous indicators are present in the trading world.
Wrapping Up
We have a detailed study on what is an oscillator and its types with pros and cons. Trading oscillators may have some advantages and disadvantages. However, you can deal with its disadvantages efficiently with proper knowledge.
Oscillators are powerful tools to take your trading journey to the next level and identify profitable opportunities. You just need to take confirmation and fundamental analysis into consideration. It will help you make effective trade decisions and avoid false signals.
Category :
Share :