Divergence is amongst the most popular elements of technical analyses. These tools are really helpful while trading in financial assets. However, many traders find difficulty in trading divergence. This article will teach you the concept of divergence, its types, and indicators to spot them.
What is Divergence trading?
Divergence is a trading condition when the price moves in the opposite direction of the indicator interpretation. Basically, it is when indicators and price movement tell a different story.
Divergence is a helpful indicator to get effective and reliable trading insight that guides you in placing trades. These trading indicators suggest that the current trend may be weakened or the asset’s price may move in the opposite direction.
Types of Divergence in Trading
For a better understanding of the concept of divergence in trading, let us briefly understand its kinds. It will help you in using the technical analysis tools effectively.
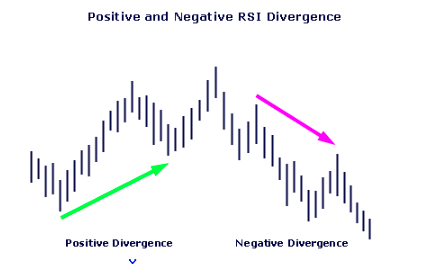
Positive Divergence
When the asset price is moving in a downward direction, but the indicators are showing bullish signals, it is termed a positive divergence. It signals that asset prices will soon move in the upward direction.
Negative Divergence
When the asset price is moving in the upward direction, but the indicators are showing bearish signals, it is termed a negative divergence. It signals that asset prices will soon move in a downward direction.
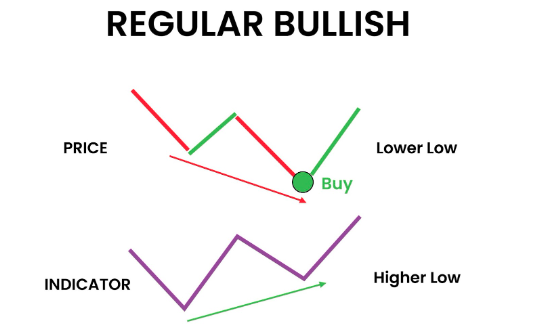
Regular Divergence
It is also known as classical divergence and is quite common in trading. It occurs when the price is making a higher high, but the indicators are making a lower high. It usually suggests trend reversals or temporary pullbacks.
Divergence is a trading condition that occurs when the price moves in the opposite direction of the indicator interpretation. Basically, it is when indicators and price movement tell a different story.
When the price makes a lower low and indicators make a higer low. It suggests that the current downtrend is weak, and the uptrend is expected to start, indicating traders to make open a long position.
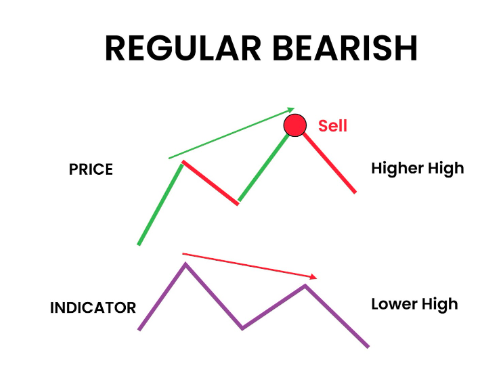
Regular Bearish Divergence
When the price makes a higher high and indicators make a lower high. It suggests that the current uptrend is weak, and the downtrend is expected to start, indicating traders to make open a short position.
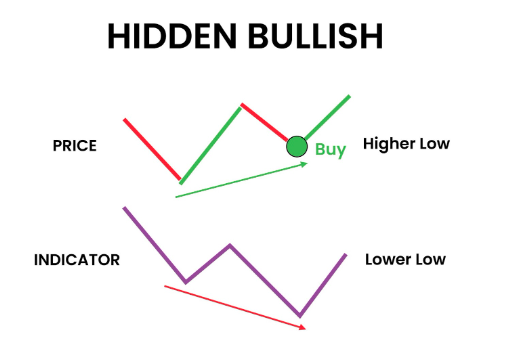
Hidden Divergence
It occurs when the price of an asset and the indicator move in the same direction, suggesting the continuation of ongoing trends due to price pullbacks. One can spot hidden divergence when the price makes higher lows, and the indicator makes lower lows, or when the price makes lower highs, and the indicator makes higher highs.
Bullish Hidden Divergence
It occurs when the price makes higher lows, and the indicator makes lower lows, indicating the continuation of the uptrend. It signals traders to open a long position due to the expected bullish reversal.
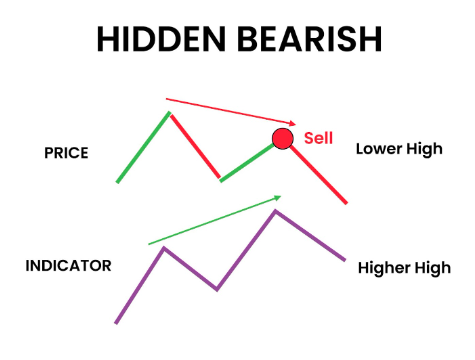
Bearish Hidden Divergence
It occurs when the price makes lower highs, and the indicator makes higher highs, indicating the continuation of the downward trend. It signals traders to open a short position due to an expected bearish reversal.
Indicators to watch to spot for trading divergence
Advanced divergence trading requires an advanced approach. Spotting and interpreting divergence is not easy. Also, If not used properly, these tools may generate false signals. Therefore, to use the power of divergence, one should combine technical analysis indicators with it. Let us have a look at popular indicators and how to use them:
Stochastics Oscillators
Oscillators are among the most useful tools for gaining valuable market insights, especially in spotting divergence. The indicators consist of two lines where the price oscillates within the range of 0 to 100. You can simply add the oscillator to the trading chartfor trend identification and price movement respective to the indicator for spotting divergence.
Relative Strength Index
RSI is amongst the most popular, widely used, and simplest technical analysis indicators developed by J. Welles Wilder. It helps to determine the relative strength of the current price with respect to the historical price pattern over a period.
Under this, when the indicator moves above the key level of 70, it suggests overbought, while when the indicator moves below 30, it suggests oversold conditions. So, you can use these indicators for identifying entry and exit points, potential price reversals, and divergence.
Moving Averages Convergence Divergence
As the name suggests, the technical analysis tool is designed to spot divergences. You can simply plot MACD in your trading divergence chart and identify divergence when the price of an asset moves in the opposite direction of MACD. Apart from divergences, you can identify potential bullish and bearish reversals.
Other Indicators
We have discussed the most used indicators for spotting divergence; however, you can also use indicators like commodity channel index moving averages, to spot divergence. Also, the identification of support and resistance, trend lines, breakouts, and pullbacks provides you with key insight to spot and validate the divergence.
Things to remember while trading in divergencee
Divergence can help you in making trade decisions effectively. However, for trading divergence, you need to take care of certain factors. Let us briefly discuss the following:
Confirmation
Like any other technical analysis concept or tool divergence is not 100% foolproof. Therefore, confirmation is a must. You cannot rely solely on these trading signals. So you can refer to trendlines, oscillators, relative strength index, breakouts, or support and resistance for conformation.
Treat divergence like Indicators
Divergence can serve as a useful tool to make well-informed decisions, identify false signals, and spot trend reversals. However, one of the biggest mistakes traders make is opening a position based on divergence. But that’s not the right way divergence can be regarded as trade indicators but not as trade signals.
Consider Price reversal
Another crucial aspect to remember is not all price reversals result in divergence. Price reversal is essential to spot and validate divergence. Also, divergence lasts long before a reversal. So, consider the effectiveness of price reversals for interpreting divergence.
Consider Risk
Like any other strategy, trading divergence involves certain risks. Also, false signals and lack of confirmation further increase the amount of risk. One should keep the risk factor in mind and make proper use of stop loss in order to avoid excessive risk.
Consider Market Conditions
One of the biggest mistakes traders make while trading in divergence is overlooking market conditions. However, while using any of the technical analysis concepts or indicators, one should always consider the current market conditions, news, and economic calendar events.
Go for multiple timeframes
The best way to get a clear picture of technical analysis conditions is to look at charts for multiple time frames and make trade decisions considering the overall trend. Especially while divergence trading, one should always consider multiple time frames before making the trade decision.
Wrapping Up
Divergence is a key tool for technical analysis that is helpful in trading forex, cryptocurrencies, commodities, stocks, or indices. It provides traders with useful trading insight to make the buying and selling decision accordingly.
Understanding the concept of trading divergence strategy and using it for placing trade are two different things. In order to get a practical understanding of divergence trading, one should go for demo accounts.
Also, the best way to trade divergences is to combine them with other technical analysis indicators and take overall market conditions into consideration. It will increase the effectiveness of your trading decision and maximize your profit potential.