The Traders Dynamic Index is an all-in-one indicator – this powerful trading tool helps traders spot trends, market strength, and momentum. It became most popular by the “Synergy” trading approach and continues to be used in Forex Trading.
MarketInvestopediasupports traders through exceptional tools and the TDI stands as an excellent resource for traders who want to enhance their trading approach.
More than 65% of retail traders use indicators like the TDI to improve their entry and exit decisions, per MetaTrader 4 user data.
Quick Overview:
Blend of Relative Strength Index (RSI), Moving Averages, and Volatility bands.
Designed to avoid signal overload and simplify technical analysis.
Best for scalping, also works well for swing trading and trend-following.
Thanks to TDI’s clear symbols, beginners can even easily and confidently monitor market movements.
TDI helps you to see the trends, direction, and strength of the market. When the green line crosses above the red line, it may be time to buy; when it goes below, it may be time to sell.
Many traders use Bollinger bands, MACD, RSI, and Moving Average. These indicators help traders know when to buy or sell, or show the trend, strength, and possible changes in the price.
TDI is a combination of three things: RSI (shows strength), Moving averages (shows trends), and Bollinger Bands (to show price range). These work together to help traders understand the market better.
Look at the blue, green, and red lines. When the green lines go above red, it may be a signal to buy. When it goes below it may be a sell signal. The blue lines show the market range.
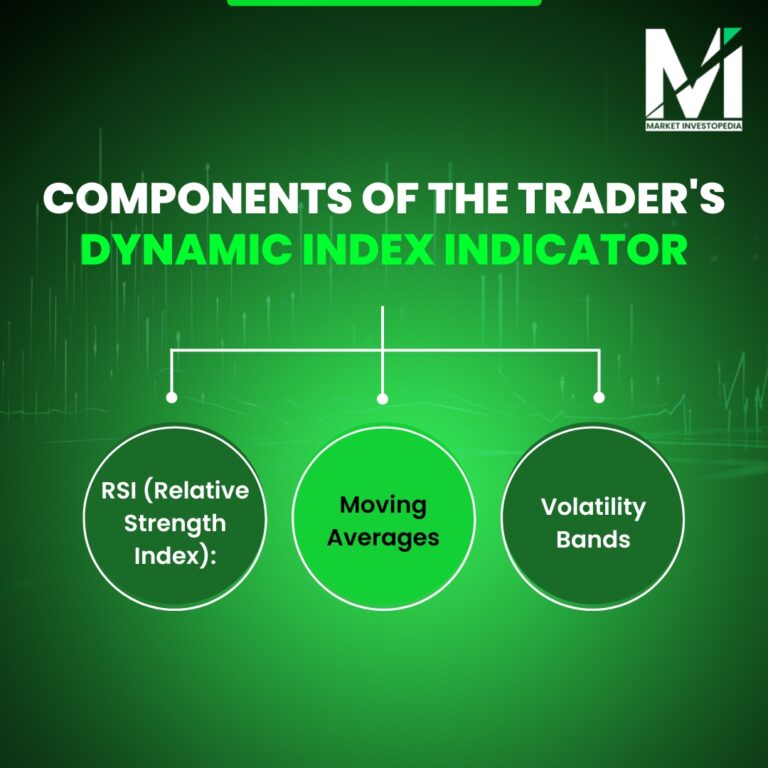
Key Components of the Trader's Dynamic Index Indicator
The TDI consists of three essential components that function as a system to display market activity.
Main Elements:
RSI (Relative Strength Index):
The indicator evaluates price speed alongside movement changes to detect market conditions of overbought and oversold states.
If it goes too high or too low, very fast, it helps the traders to analyze when the price might reverse.
Moving Averages (Signal Line & Market Base Line):
The moving averages smooth the RSI while enabling traders to determine trend direction and strength.
This makes it easier for traders to understand that if the market is going up, down or staying flat in a very easy way.
Volatility Bands (Bollinger Bands):
Market movements are best expressed through these indicators to detect breakouts. This helps traders to analyse when the price might move quickly in one direction.
Through this combined methodology, traders can view the entire price activity from one consolidated platform. TDI functions as a complete trading system because it exists within a single indicator.
TDI Technical Analysis: How to Interpret the Signals
For the first time, one might find Traders Dynamic Index tricky, but once you understand the signals, it becomes a powerful tool for decision making. It helps you understand what the market is doing. It shows if the price is strong, weak, or going sideways which helps with when to buy, sell, or stay out of the market.
The green line is the main one to focus on, it shows direction and strength of the market. When it moves upward sharply, that usually means start buying. If it goes down it means selling pressure is high. A flat green line usually means the market is stable.
The red line works in parallel with the green line. When green crosses and moves past the red line, that’s the signalto buy. When it goes below the red line, that’s your clue to sell. The yellow line shows the overall trend.
If both the red and green lines are above the yellow line this supports the buy setup, vice versa if these are below yellow line, that points sell setup.
The blue band shows how active the market is. Wide bands mean more movement and possible breakouts. Tight bands suggest low activity.
Popular Trading Strategies Using the TDI Indicator
Different trading styles are acceptable with the Traders Dynamic Index. You can use it in your daily trade in the following three easy ways:
1. Trend-Following Strategy
This is the easiest strategy to follow in TDI. When the green line crosses above the red line and both are above the yellow line then it’s time to buy. When the green line crosses below the red line and both are under the yellow line then it is an indication of selling. This will help you follow the trend, and not go against it.
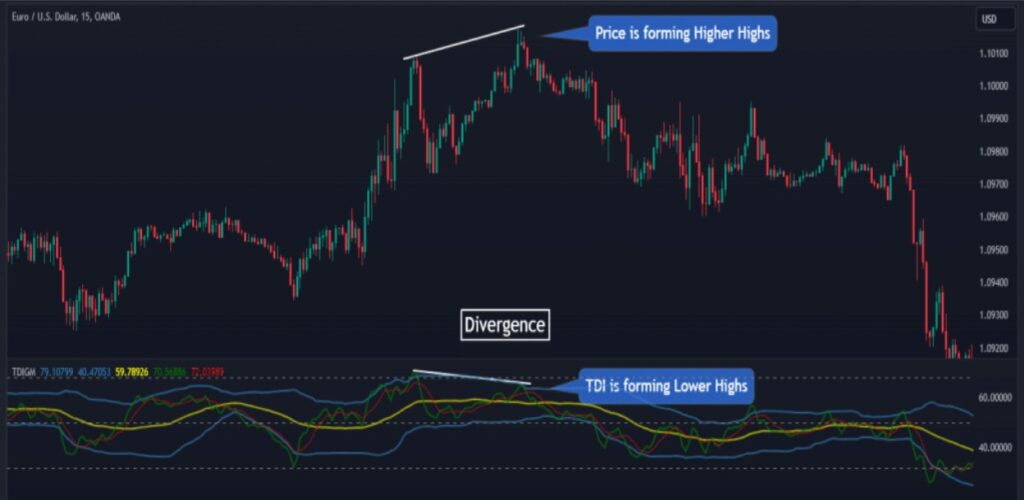
2. Reversal Strategy
Sometimes, after a strong move, the market changes direction. When the green line touches or nears the blue bands and curves in the opposite direction, this may be a sign of reversal. This strategy works better when the price also shows signs of slowing down.
3. Scalping Small Moves
For the fast traders, have the constant watch on the green and red lines in short timeframes (like 5 or 15 minutes).Quick crossovers might give the signalsof profit. This method works in pek market hours.
Always use extra confirmation to choose any of these strategies, like price, patterns, support, etc.
Is the Traders Dynamic Index the Right Tool for You?
The TDI serves as an excellent tool for quick trading decisions because it remove the need to switch between multiple indicators. The indicator provides clear visualization of market behavior that becomes essential during fast trading decisions.
MarketInvestopedia recognizes the significance of efficient trading tools and the TDI emerges as a top choice for traders because of this reason.
The TDI indicator stands apart because it adjusts its behavior according to market condition changes. TDI provides adaptability between short-term and long-term trading because of its momentum, trend, and volatility components. The tool receives praise from traders because it functions across multiple periods and trading instruments.
Waiting for clear signals delivers the best results using the TDI as a trading indicator. Investment during poor market conditions tends to produce uncertain returns. A trading plan should accompany TDI usage because it provides effective results.
The Traders Dynamic Index functions as a valuable trading component when used properly with consistent application.