
Price Action Trading Forex Strategies for Every Trader
Other Post


An effective strategy is key to becoming successful in Forex trading. There are many strategies a trader can use to place the trade. In this article, you will learn price action trading forex, the most popular trading strategy.

What is a price action trading strategy?
A price action strategy is a trading method that helps to foresee the market’s movement through trading signals or by spotting trading patterns of a primary market. Price action in trading forecasts the market in the future by studies of the performance of a security, index, or currency.
For example – if your price action informs you about the price might be increasing, then you might need to take a long position, or if you think that price will decrease, you might take a short position.
This strategy includes determining the key price action indicators that affect your investments and watching trading patterns. Several traders utilize various price action strategies to foresee the market’s movement and create short-term profits in the future.
A quick glance
A price action strategy is a trading method that helps to foresee the market’s movement through trading signals or by spotting trading patterns of a primary market.
If your price action informs you that the price might be increasing, you might need to take a long position, or if you think that price will decrease, you might take a short position.
- Long wick Candlesticks
- The Hammer
- Inside Bar
- Trend line Trading
- Spring at support
-
Breakout
-
Candlesticks
-
Trends
-
Support and Resistance
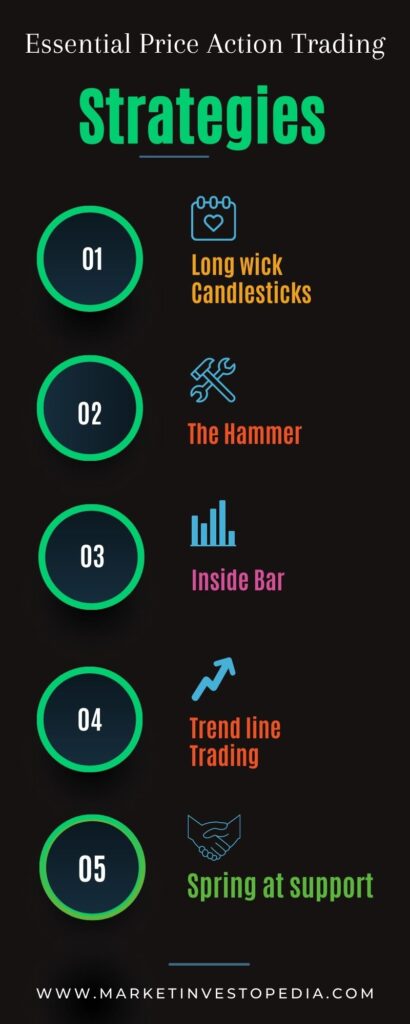
Essential Price Action Trading Strategies
We used several price action patterns and strategies for future forecasts and profitable trading. Some popular price action strategies are as follows:-
- Long wick Candlesticks
- The Hammer
- Inside Bar
- Trend line Trading
- Spring at support
LONGWICK
Longwick is the most popular price action entry and exit strategy. A candle in the market defines through its body and wick. The body represents the space between the opening and closing prices, while wicks mean the high and low extremes.
For example, A long upper wick candle represents that the buyers tried to take some distance in the period to push the prices higher, but sellers managed to return prices close to the opening price and opposed the attempt. A price action trader can support the sellers again in the next period through this information.
THE HAMMER
The hammer is a candlestick that peeks like a “hammer.” It develops in this form because they open, high, and close each other, while it acts as a hammer candle, and the low is long. Traders typically consider hammer as a trend reversal.
INSIDE BAR AFTER BREAKOUTS
When breakouts happen, the challenge for traders is to find out if it is real or fake. An Inside after breakout design is when one or more candle exchange within the highs and lows of the big breakout candle. Thus the name “inside.”
The psychology for the Price action setups is that market players are forced to share any profit breakouts and are willing to support and close the new trend moving ahead. At least, This price action strategy shows the comparison between the candles.
TRENDLINE TRADING
Trendline trading utilizes the lines to show the optimal moments to join trades in trending markets. A trendline is removed in an uptrend from a specific swing low to the next one and then launched into the future.
A perfect price point for entering the uptrend represents the retracement to the trendline. In markets, outline the support and resistance areas you will use in horizontal trendlines.
SPRING AT SUPPORT
Traders usually calls their strategies for the visual formed through the used indicator on a chart. For example, “spring at support” means a sudden increase in the price of an asset after it hits or reaches close to its asset price, or the market will help that asset at the lowest price.
TOOLS USED FOR THIS STRATEGY
You got the answer of what is Price Action Strategy in Forex. Now it is time to learn about the tools of the strategy.
The strategy of Price action trading links to recorded data and past price movements. All technical analysis methods such as charts, trendlines, price brands, high and low swings, and technical levels like support and resistance, breakout, and candlestick are selected per trader and trading strategy.
The traders can observe the tools such as price bands, bars, breakouts, trendlines, or complex combinations, including candlesticks, channels, volatility, etc.
4 Important Tools for This Strategy
If you are wondering how to master price action trading strategy, here are some tools that help to make an effective plan and master the art of price action plan.
Breakout
When the price of assets moves with a particular movement, it warns the traders to find a likely new trading option once it fails that movement.
For example – For the last 20 days, assume that a stock has traded between $10 and $1, then it moves beyond $11. This difference in movement warns the traders that the perhaps sideways movement has ended and that a potential move from $12 to $13 or some higher has formed.
Breakouts arise from various patterns, including head and shoulders, ranges, and flag patterns. A breakout doesn’t suggest that the price will resume in the expected direction. In that situation, it is called a false breakout. It also shows an opportunity for trading in the opposite direction of the breakout.
Candlesticks
Candlesticks charts are one of the best tools for price action strategy. The chart of graphical representation indicates the trend, open, close, high and low price of an asset. Traders use candlesticks in multiple strategies. For example, some traders utilize the engulfing candle trend method when the analyst uses candlestick charts.
Trends
An asset can be traded all day, with prices rising or falling. Traders guide these changes as “bullish” trends, where the cost increases, or bearish trends, where the price drops.
Support and Resistance
It connects to all of the above tools; traders utilize the price support and price resistance areas to specify good opportunities for trading. Support and resistance areas appear when the price has managed to change in the past. Such levels may evolve appropriately again in the future.
How Does Price Action Trading Strategy Work
Numerous experienced traders follow the price action entry rules. They support the various options for identifying trading designs, stop losses, entry and exit levels and connected statements.
Just keeping one method on numerous stocks may not provide good trading options. Most plans involve a two-step process.
- Determining a scenario: A stock price reaching into a bull/bear stage, channel range, breakout, etc.
- Within a scenario, specifying opportunities for trading: Overshoot or retreat once the stock is in a bull run. It is an entirely personal selection and can range from one trader to another, even providing the exact design.
- As per the traders’ view, a stock increases and then reverts to a little lower scenario. The trader can select whether they think it will make a double top to reach higher or drop by following a regular reversal.
- The trader places on a floor and top for a specific price of stocks based on the idea of lower tendency and absence of breakouts. Suppose the price of stocks lies in this field. In that situation, the trader can carry positions considering the fixed ceiling or floor as support and resistance levels or bring an alternate idea that the stock will break out in any direction.
- A determined breakout scenario living met and opportunity of trading living in times of continuance breakout which is going further in a similar direction or breakout pull-back.
- As can be noticed, the price action trading is near supported via the analysis tools. Still, the last trading call is conditional on the signal trade. Providing flexibility rather than implementing rigid rules to be followed.
Conclusion
It is a must for beginners to know what is a price action strategy in forex exchange as it will help them to choose how you execute the trading. If you want to educate yourself by learning a trade, you only need to start learning to the method first.’
Selecting the best price action strategy based on your needs is essential. It helps you to analyze the charts and place your trade accordingly. It also helps to create a short-term profit. But remember that it doesn’t guarantee profits; it makes a good trading technique through time and practice.
Share The Post with others
Category :
Share :