Technical analysis indicators can guide you to dive into the ocean like financial markets. The tools help you to identify when to open and close trades and how to do so.
Multiple technical analysis indicators are present in the market. Which to choose is totally depends on your understanding and requirements.
In this blog, we will going to tell you about the true strength index.
The TSI indicator is a powerful technical analysis indicator. Let’s have a look at the TSI definition and how to use it to identify buy or sell opportunities in the market.
What is the True Strength Indicator?
A True Strength Index is a momentum-based oscillatorto measure the strength of a financial asset’s price movements. It was developed by William Blau in the 1990s and is used to trade diverse assets in diverse markets.
A TSI indicator is popularly known as a trend strength indicator or trend strength index. As the tools provide key insights into the current market trends, their strength and even confirm them. In addition, traders can identify the overbought and oversold conditions and potential trend reversals.
RSI and TSI both are oscillators; however, RSI oscillates between 0 to 10,0, and TSI oscillates between +100 and -100. So the interpretation becomes different.
TSI oscillates between +100 and -100. When the TSI crosses above the zero level, it suggests a strong bullish trend, and when the TSI falls below the zero level, it suggests a strong bearish trend.
TSI oscillates between +100 and -100. Whenever the price crosses a key level, the indicators give an indication, and traders can place a trade accordingly.
Use the True Strength Index in combination with other technical analysis indicators such as the Relative Strength Index, moving averages or volatility indicators for confirmation.
Key Components of True Strength Index Strategy
For using TSI indicators, clearing basics is a must. Let’s look at the components of TSI that will help you in efficiently interpreting the indicator:
Price Momentum Line:
A PML line represents the momentumof the price changes in the financial asset. It is the difference between the current and previous closing price.
Volatility Smoothing:
The TSI indicator uses a volatility smoothing for the PML data. It helps in reducing the probability of false signals, and the indicators work well low and high volatility periods.
Signal Line:
The TSI even has the exponential moving average line called as signal line. It helps in generating potential and comprehensive signals.
How to Interpret the True Strength Index
Now you know what TSI is, but do you know how to trade using the strategy? Here is a step-by-step process:
Watch the levels:
The TSI oscillates between +100 and 100. So you need to go to a trading chart platform, select the TSI indicator, and watch the lines.
Determine Overbought and Oversold Conditions:
TSI helps traders identify the overbought and oversold conditions. When the price moves nears +80, it suggests overbought conditions and meaning that the price is all set to reverse. In this case, traders can consider opening a buy position.
When the price moves nears -70, it suggests oversold conditions and meaning the trend is all set to reverse. In this case, traders can consider opening a sell position.
Identify Bullish and Bearish Opportunities:
When the TSI crosses above the zero level, it suggests a strong bullish trend, and traders can consider opening a buy position.
When the TSI falls below the zero level, it suggests a strong bearish trend, and traders can consider opening a sell position.
Determine Price Divergence:
Divergence is when the price moves differently from the indicator interpretation. A bullish divergencehappens when the asset price makes lower lows and the TSI makes higher lows. In such cases, traders can consider opening a buy position, hoping for a reversal.
Meanwhile, a bearish divergence happens when the asset price makes higher highs and the TSI makes lower lows; traders can consider opening a sell position, hoping for a reversal.
Seek Confirmation:
When trading the true index indicator, do not make a decision solely based on the TSI indicator. Use the technical analysis indicators such as the Relative Strength Index, moving averages or volatility indicators for confirmation. Also, you can even use charting patterns, trend lines, support and resistance for further confirmation.
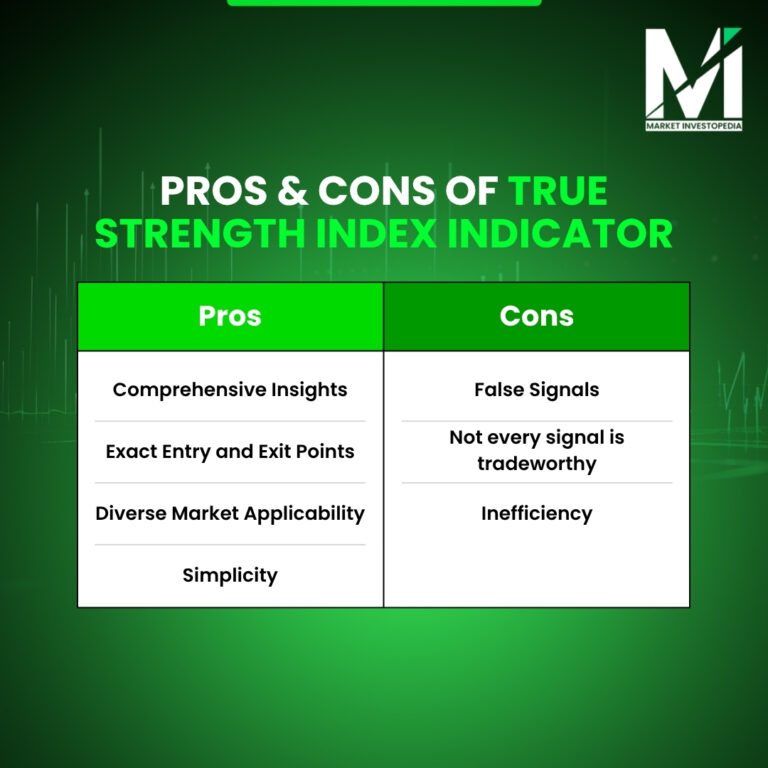
Pros of True Strength Index Indicator
Comprehensive Insights:
TSI provides a comprehensive analysis of asset prices to the trader. You can determine the overbought and oversold conditions, potential trend, trend reversal and their strengths, divergence and other key information.
Exact Entry and Exit Points:
When using the True Strength indicator in the best settings, traders can identify the exact entry and exit levels. Also, traders can even set the stop loss and take profit level accordingly.
Diverse Market Applicability:
The True Strength Index is applicable to diverse markets. Whether you are a stock trader, forex, crypto, indices or commodity trader, you can use the tool.
Simplicity:
Traders can use the TSI indicator formula to calculate the TSI or can even do it using automated tools. Also, using and interpreting TSI is quite simple, and even beginners can do it.
Cons of True Strength Index Indicator
False Signals:
The TSI is not a foolproof indicator, and it gives false signals. And in such cases, traders may end up making a wrong decision and suffer a significant loss.
Not every signal is tradeworthy:
Many times, the TSI indicator will suggest that you enter or exit a trade. But not every time will the price move accordingly. In such a scenario, only a trader with proper knowledge can differentiate whether to trade the signal or not.
Inefficiency:
The TSI does not work well during high or low volatility, unstable market conditions, big news releases, or announcements. So the indicator may not provide effective interpretations during such scenarios.
Wrapping Up
The True Strength Indicator is a valuable tool to get a comprehensive price overview of the financial asset. Traders can decide whether to go long or short and how to use it.
It may have some limitations, but which technical analysis tool does not? And dealing with these drawbacks is quite easy; you just need to use it properly with confirmation. Also consider fundamental and sentimental analysis for maximum efficiency.
Want to get a practical understanding of technical analysis indicators. contact us to attend our insightful webinars with market experts.