Trading patterns are confusing? If you also feel the same, then you are probably learning the wrong way. Each candlestick pattern is different and gives a different interpretation.
In Market Investopedia’s charting pattern series, today we will discuss the Triple Top pattern with pros and cons. It will help you in interpreting the pattern efficiently and place trades like a market pro. So let’s get started.
What is a triple top pattern?
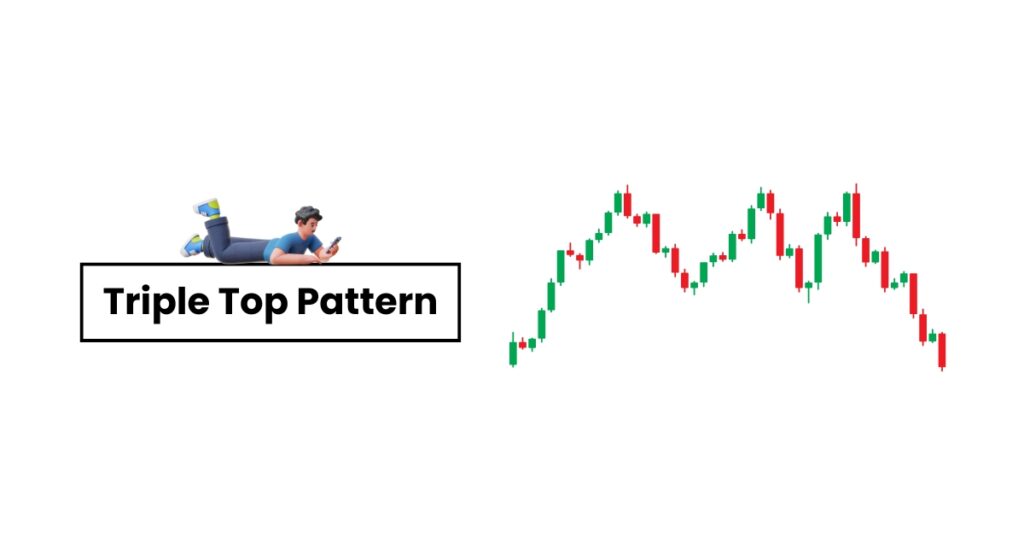
A triple top is a technical analysis candlestick pattern that suggests potential for a bearish reversal. As the name suggests, the pattern contains three peaks of similar heights.
A triple pattern occurs when bulls try to move the price upward. However, bears managed to push the prices back. The pattern ends with a breakoutof support, indicating that bulls have lost momentum, and sellers manage to reverse the trend.
The triple top pattern gives 50 to 70% accuracy. Also, the reliability of the pattern depends on how effectively you have identified and interpreted the pattern.
Yes, a triple top is stronger than a double top because the price has reached the resistance level three times and reverses back, suggesting a strong potential for bearishness.
A three-top pattern, also regarded as a triple top, is a bearish reversal technical analysis pattern with three tops and two troughs.
Key Components of Triple Tops
Trend: As you can see in the above image, a triple top pattern forms after a strong uptrend.
Three Peaks: A triple top has three peaks of similar heights. The level is not always the same, but it is on or near resistance.
Pullbacks: The pattern consists of two minor pullbacks that form when the price reverses after touching the resistance.
Neckline: The level at which the troughs drop and reverse is regarded as the neckline or support.
Horizontal channel: The patterns form a horizontal channel consisting of two parallel lines that act as support and resistance.
Breakout: The pattern confirms the breakout of support (neckline), indicating a potential for a bearish reversal.
How to trade the Triple Top Pattern
Identify the Trend
Open a trading chart, select the asset and the chart time frame. Now, identify the prevailing trend as patterns occur during a strong bullish trend.
Spot the Triple Top
A triple forms an M-shaped structure. The only difference is that it has three tops instead of one. So, look for the M shape structure with three peaks and two troughs.
Wait for Breakout
A triple top pattern confirms when the price breaks the support level. So, wait till the breakout in the downward direction occurs.
Confirms the Pattern
A trader should place a trade only when the pattern is strong. And that you can confirm in many ways. The first indication is the clear neckline breaks. Second, high selling volume during the breakout.
Use Trading Indicators
A Triple top occurrence is not sufficient for placing trades. Thus, combine the candlesticks with indicators such as Bollinger bands, oscillators, RSI, moving averages, and Fibonacci retracement.
Open a Sell Position
A breakout of the neckline indicates that prices are about to fall. So, consider opening a bearish position. Enter the trade below the neckline, and set a stop loss above the breakout level. Also, the take profit level should be set according to the heights between tops and bottoms.
Advantages of the Triple Top Pattern
Easy to Spot
Identifying a triple top structure is relatively easy. You can even draw the line on the chart, support, and resistance for proper identification.
Versatility
The Triple top pattern occurs in both short-term and long-term time frames. You can use it whether you are a scalper, day trader, swing trader, or position trader. Also, you can trade in diverse financial instruments such as forex, stock, indices, commodities, crypto and others using the pattern.
Multiple ways to confirm
Like any other pattern, the triple top also requires confirmation. However, you can confirm it in multiple ways. The support breakout and increasing volume work as confirmation. Also, you can even spot other candlestick patterns and technical analysis indicators for further confirmation.
Disadvantages of the Triple Top Pattern
May Indicates Indecisions
ATriple top is a bearish reversal pattern, but not always. Meaning that the price may move sideways after a breakout, suggesting indecision. In such cases, traders end up making the wrong decision.
False Breakout
High volatility and sudden changes in market conditions may result in false breakouts. During such scenarios, triple top may not be an ideal indicator
Confusing
Many traders can confuse the triple tops with similar patterns, such as double tops or triple bottom patterns. However, the interpretations of these patterns are completely different. So when trading these patterns, traders need to be vigilant about the pattern’s key criteria.
Bottom Line
The triple top pattern is a valuable indicator for traders looking for short-selling opportunities. However, the success depends on how effectively you identify and interpret it.
If your basics are clear and you use proper confirmations, then the pattern can help you place profitable trades. Also, there are many similar patterns, like the triple top pattern.
Thus, knowledge of diverse trading chart patterns and indicators is important. Explore our blog section to master the major trading patterns. You can even reach out to us and seek the help of our professional reachers.