Stochastic Momentum Index (SMI)
Whenever you search for an ideal technical analysis indicator generally some popular names generally come up in the list. It includes the Bollinger Bands, Moving Averages, RSI, and Oscillators.
And why not? These are the most widely used indicators. Almost every trader has at least once used them. However, if you are looking for something different, this blog is for you.
Here we will going to discuss one lesser-known yet effective indicator, the Stochastic Momentum Index, how to use and interpret it.
What is a Stochastic Momentum Index (SMI)?
Stochastic Momentum Index is a technical analysis indicator that helps to track the momentum of an asset by calculating the distance between the current closing price and the median of high or low price changes.

The Stochastic Momentum indicator was developed by William Blau in 1993. It is an enhanced version of the stochastic oscillator that takes refined prices into consideration for providing better interpretations.
Under this, the price oscillates between +100 to -100. A positive value indicates that the closing price is higher than the median of the high/low range. Meanwhile, negative values indicate that the closing price is lower than the median of the high or low range.
A quick glance
Stochastic Momentum Index is a technical analysis indicator that helps to track the momentum of an asset by calculating the distance between the current closing price and the median of high or low price changes.
RSI is an oscillator where price oscillates between 0 to 100. While stochastic momentum is an indicator where price moves between +100 to -100. Both are useful to identify potential trading opportunities.
The stochastic momentum index is one of the best indicators to identify overbought and oversold conditions, trading divergence, and price crossovers.
Stochastic 5-3-3 is an aggressive trading setting used by fast traders, whether they reduce the k% to 5 and keep the D% and smoothening period as 3.
Key Components of Stochastic Momentum Index
SMI Line or % K Line: It is the main line of the indicator that represents the raw momentum of an asset over a period.
Signal Line or % D Line: It represents the moving average of the SMI Line, usually of more than three days.
How to Interpret the Stochastic Momentum Index
SMI can provide different interpretations that ultimately help traders in placing trades. Here is how you can identify buy or sell opportunities using the indicator:
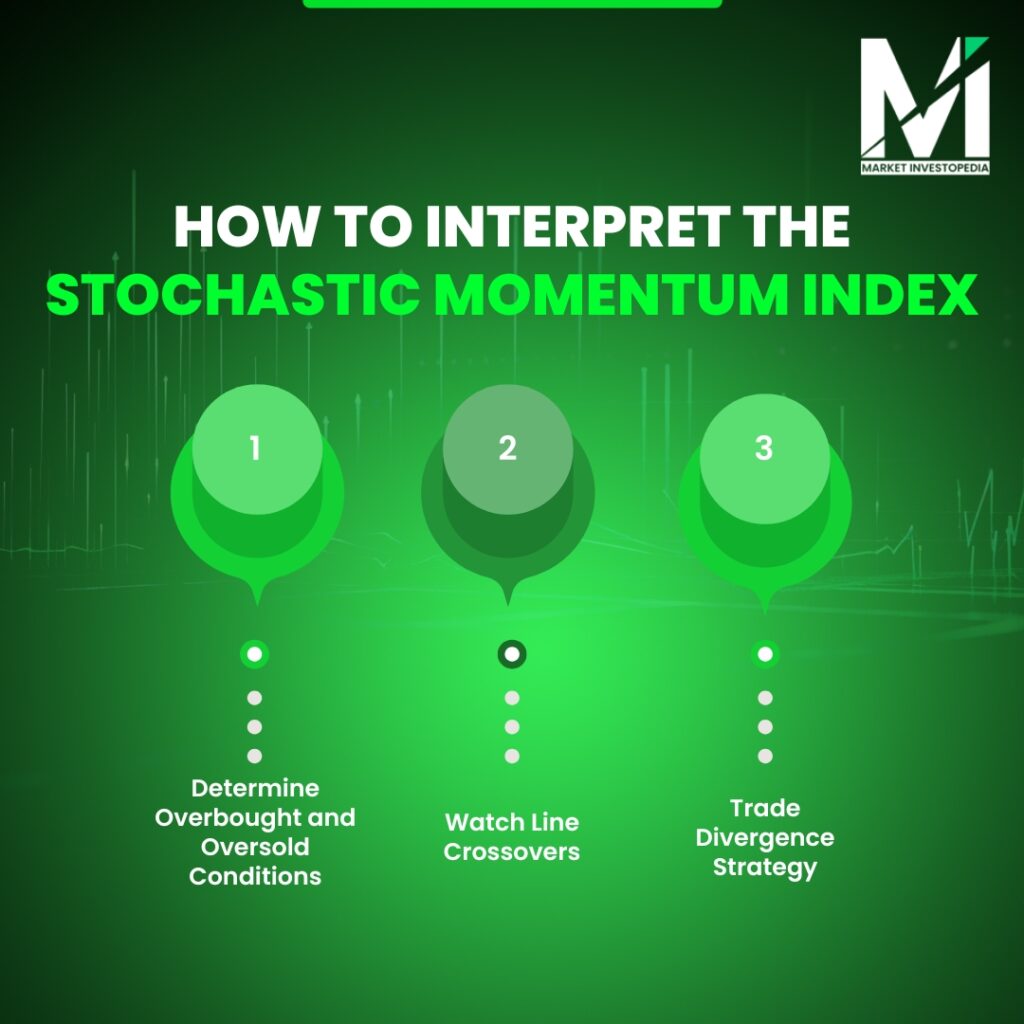
Determine Overbought and Oversold Conditions:
You can even identify trading opportunities by watching the SMI line crossovers. When the SMI moves above the signal line, it suggests an increase in momentum, indicating that traders to open a buy position. When the SMI moves below the signal line, it suggests a decrease in momentum, indicating that traders to open a sell position.
Trade Divergence Strategy:
You can even identify potential price divergence using the SMI indicator. When the SMI line makes higher lows and the asset makes lower lows, it suggests a bullish reversal, and traders can consider opening a buy position.
Meanwhile, when the SMI line makes lower highs and the asset makes higher highs, it suggests a bearish reversal, and traders can consider opening a sell position.
Advantages of Stochastic Momentum Index
Compatible Indicators:
Technical analysis indicators, including the SMI, can produce false signals. Thus, confirmation is a must when trading using this strategy. SMI is a compatible indicator, which means you can combine it with numerous other indicators for effective interpretations.
Wide Applicability:
SMI scope is not limited to a single market or an asset. You can use the indicators for trading diverse assets, including the forex pairs, stocks, commodities, indices, and others. That’s not it, you can even use the indicators for short-term, medium-term term or long-term trades.
Free:
The best part about the indicator is that you can use it for free. You can either use Stochastic Momentum Index MT4 or Stochastic Momentum Index MT5. Both platform provides the tool for free.
Comprehensive Overview:
You can get a comprehensive overview of the asset price movement over a period. SMI can help you in identifying overbought and oversold conditions, trading divergence, and trade entry and exit points.
Disadvantages of Stochastic Momentum Index
False Signals:
Like any other technical analysis indicator, SMI can generate false signals, especially in a choppy market. The strategy does not give you a profit guarantee. It is based on historical data and only works on the basis of probability.
Performance Dependency:
SMI is subject to one’s interpretation. Traders can make profitable trades, and some traders can even lose money even after using the same indicators. To get maximum results, you need to use the stochastic momentum index in the best setting.
Does not Consider Broad Market Conditions:
With technical aspects considering fundamental conditions such as current market news, economic indicators, geopolitical factors, etc. However, SMI only takes the historical price movements of the asset into consideration to provide the price interpretations.
Stochastic Oscillator vs Stochastic Momentum Index’
Many people confuse the stochastic oscillator with the SMI because they are quite similar. However, these are not actually the same. The stochastic oscillator is simple, it compares the closing price with the moving averages of 14 days.
However, the stochastic momentum index is an enhanced form of the Stochastic Oscillator. It compares the closing price with the median high/low range for that period.
Wrapping Up
Stochastic Momentum Index is a valuable tool to identify potential buy or sell opportunities. Whether you are a beginner or an advanced trader, you can start using the strategy with just the basic knowledge of technical analysis.
However, make sure that you get proper knowledge of the indicator and how it functions. Also, use the indicator to place demo trades first to analyze the effectiveness of your strategy.
For a comprehensive study of similar technical analysis indicators, explore Market Investopedia’s blog page. And for a practical study, reach out to attend our expertly organized webinar.