Shooting Star Pattern in Trading
Other Post


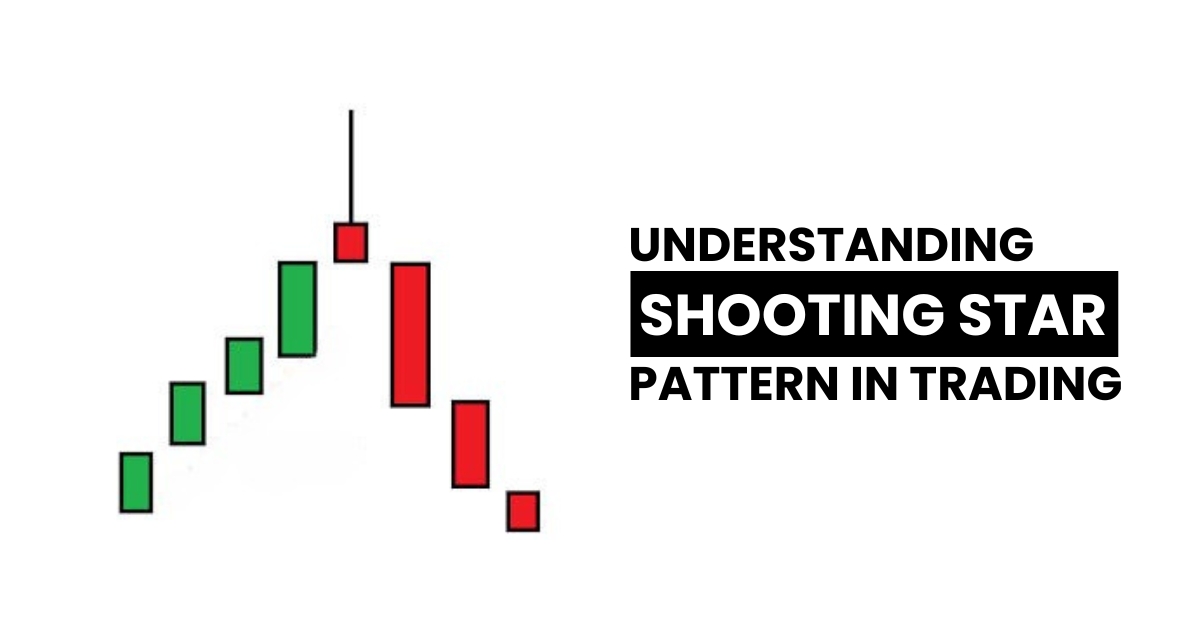
Shooting star pattern
Are you a short-term trader who loves to take advantage of falling markets? If Yes, then we will tell you about a candlestick pattern shooting star that can help you in doing so.
The shooting star candlestick pattern is a popular technical analysis tool that assists traders in identifying day trading opportunities. Wait, you don’t know about it? Not to worry. Let us quickly understand what a shooting star candlestick is and how to interpret it.
What is a shooting star pattern?
A shooting star is a candlestick pattern that signals a short-term reversal from uptrend to downtrend.
The patterns generally occur when bulls lose control over the market, and bears manage to push the prices, at least for the short term. This candlestick shooting star pattern often signals the end of a bullish move.
Key Features of Shooting Star Candlestick Patterns
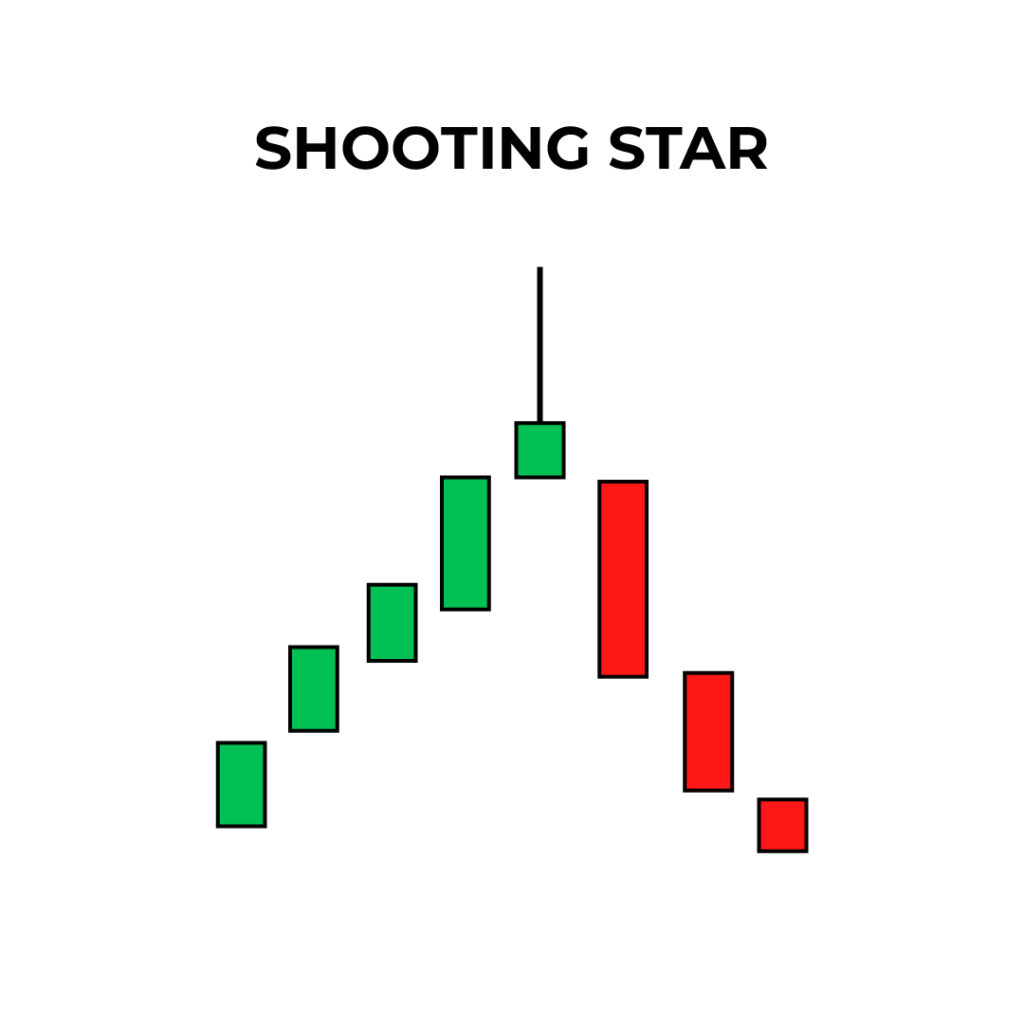
Candle: The pattern consists of a single candle at or close to the recent high.
Body: The shooting stars candlestick has a small body and a long upper tail that doubles the body with no or little lower shadow.
Trend: A shooting star candle appears after a strong bullish trend.
A quick glance
No, a shooting star candle generally appears during an uptrend. However, it signals a bearish reversal.
A shooting star pattern consists of a small single candle with a small body and a long upper tail that is double the body with no or little lower shadow.
A shooting star indicates that bears have managed to push the price at least for a short duration, suggesting a potential for a bearish move.
Yes, a shooting star pattern can be green or red in color. However, it indicates a bearish reversal.
- Watch the next candles. The next few candles should be bearish.
- Check volume. High trading volume confirms the pattern.
- The shooting star candle should appear near the resistance
- Combine shooting star with RSI, Oscillator and moving average indicator.
How to Trade Shooting Star Pattern
Identify the Pattern: The first step is to look for a shooting star candlestick pattern in a chart. Look for a small body candle with a long upper shadow and no or little lower shadow that appears in an uptrend.
Watch the Next Candles: A shooting star candle should be followed by a strong, bearish candle. The next few bearish candles will confirm that bears are gaining momentum.
Analyze the Volume: High volume during shooting star appearance signals a potential for the start of a downtrend. So check the trading volume.
Confirm with Technical Analysis Indicators: Confirm the candlestick shooting star with technical analysis indicators such as moving averages, oscillators, Fibonacci retracement or relative strength index.
Place Trade: Once you have confirmed the pattern, place a trade. The shooting star implies a reversal candle (bearish reversal), so open a sell position. Set proper trade entry, stop loss and take profit level.
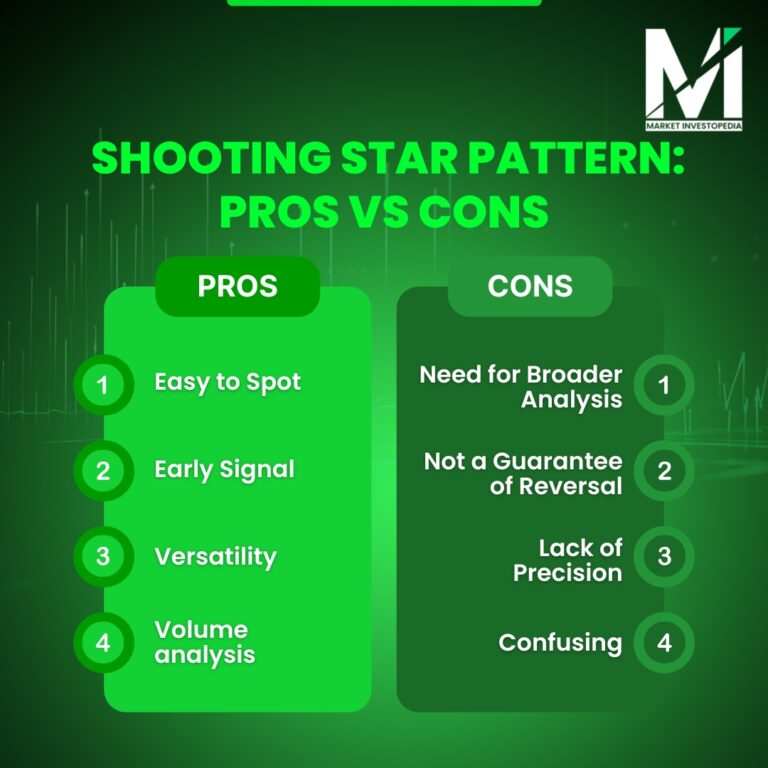
Advantages of Shooting Star Candlestick Pattern
Easy to Spot: The pattern involves the formation of only one candle. You need not watch lengthy formations, so it is easy to identify. Also, hammer charts candlesticks and shooting stars appear frequently on the chart.
Early Signal: A shooting star candlestick is an early indicator pattern. It provides early alerts for reversal candlestick patterns, giving you proper time for confirmation and effective trading decisions.
Versatility: The concept of a shooting star is applicable to diverse markets—currency pairs, commodities, metals, energy, stock, indices, ETFs, and more.
Multiple Ways for Confirmations: You can confirm the shooting star with volume analysis and subsequent candles. The appearance of shooting stars candlestick near resistance strengthens the signal. Combine with tools like inverted hammer candlestick or doji 610 for robust analysis.
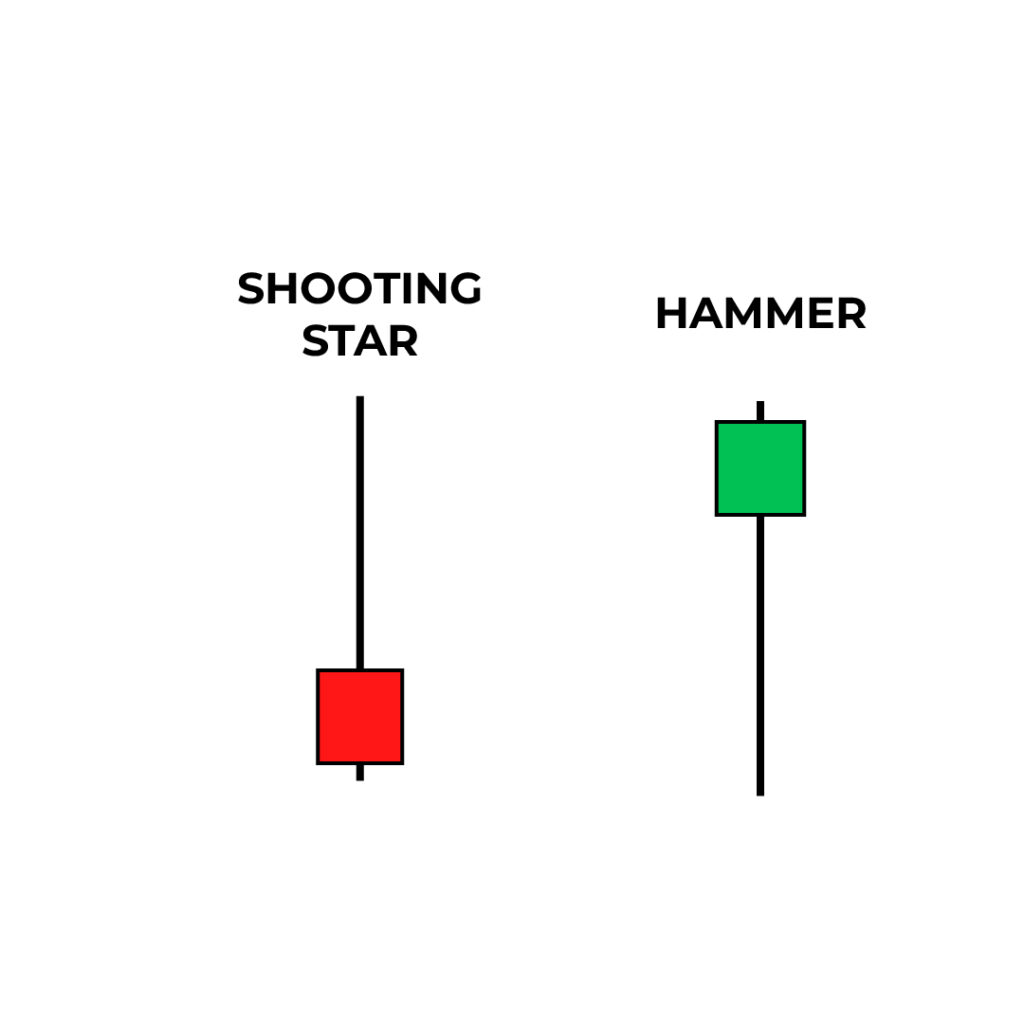
Shooting Star vs Inverted Hammer
Shooting star and inverted hammer look almost identical—small body, big upper wick, no/little lower wick. But the difference is critical: shooting stars candlestick appears after an uptrend and signals bearish reversal, while the inverted hammer candle shows up in a downtrend, suggesting a potential reversal to bullish.
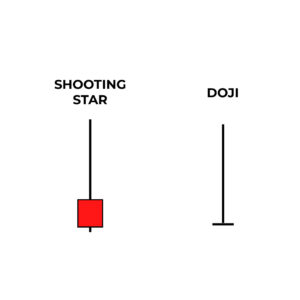
Shooting Star vs Doji
Shooting star candlestick has a small body, long upper shadow, and little or no lower shadow. A doji, like doji 610 or tombstone doji, usually has no body or a tiny one, and represents market indecision rather than a clear reversal.
Limitations of Shooting Star Candlestick Pattern
Need for Broader Analysis: The shooting star alone is not enough for trade decisions. Consider economic events, news, and additional indicators like tombstone doji or dragonfly doji to complete your view.
Not a Guarantee of Reversal: Many traders rush into positions based solely on the shooting star. But it’s not foolproof, and reversals aren’t guaranteed. Use confirmations like a bullish hammer candlestick or ibaraki doji to validate.
Lack of Precision: The shooting star pattern does not define exact entries or exits. You’ll need other tools, such as hammer technical indicators, to determine stop-loss and take-profit.
Confusing Patterns: Shooting star, inverted hammer candle, reverse hammer, and dragonfly doji can look similar. Misinterpreting one as another may lead to wrong decisions. You might mistake a bullish hammer for a doji, or confuse it with the doggy market phenomenon—a sign of volatility.
Bottom Line
Shooting star candlestick patterns can provide valuable insights to short-term traders looking for reversal candle signals in bullish markets.
However, just like hammer candle or doji patterns, this one also comes with limitations. So don’t rely on it alone. Instead, pair it with broader market knowledge, chart patterns like the hammer and inverted hammer, and support from tools like Market Investopedia.
We’re here to help both new and experienced traders decode complex patterns like the bullish hammer, reverse hammer, or even exotic formations like the ibaraki doji.
Category :
Share :