Love to trade price reversals? Who doesn’t? Traders can earn a significant amount in the market just by identifying and trading reversals.
However, determining reversals is a skill; you get the skills just by learning reversal candle patterns. Being a leading education provider, Market Investopediacan help you with that.
In this blog, we will study the top reversal candlestick patterns and their key interpretations. It will help you in spotting reversal opportunities and place trades accordingly.
What are price reversals?
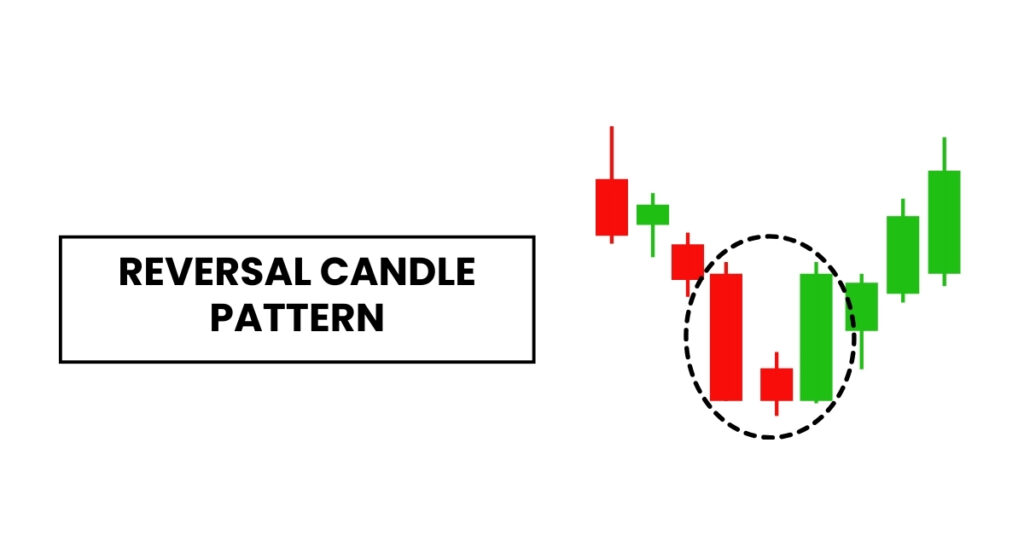
A price reversal is a scenario when the price is expected to move in the reverse direction from prevailing trends. A reversal may occur due to a change in the market or during overbought or oversold conditions.
Reversals are of two types: When a shift from an uptrend to a downtrend is expected, it is called a bearish reversal. When a shift from downtrend to uptrend is expected, it is called a bullish reversal.
A price reversal is a scenario when the price is expected to reverse from prevailing trends.
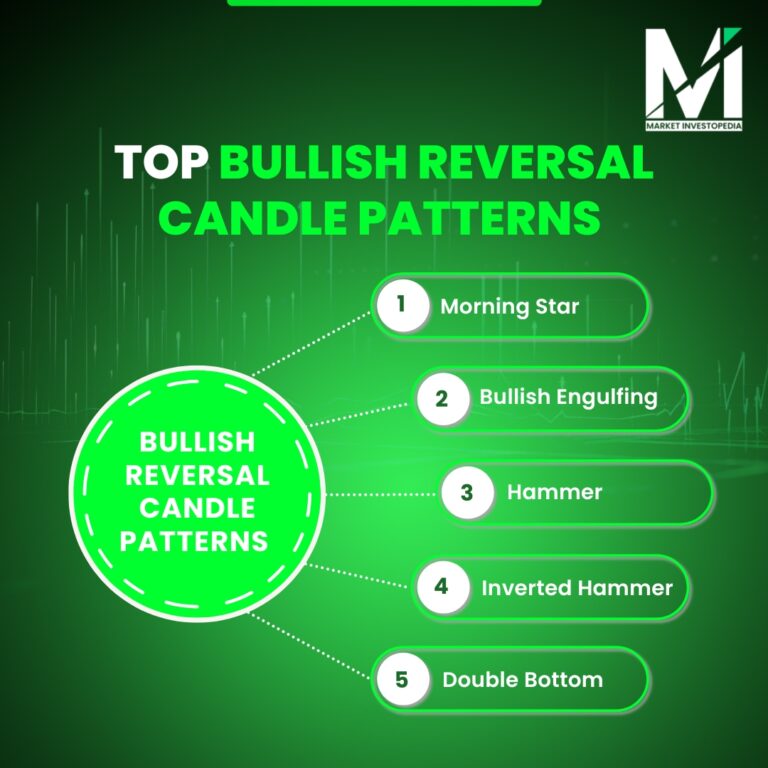
Top Bullish Reversal Candle Patterns
A bullish reversal generally occurs when sellers are controlling the market. However, the buyers enter and manage to push the price upward.
Bullish reversal candles provide valuable insights to traders. They suggest a potential for trend reversal, alerting the traders to open a buy position. Here are the most valuable bullish reversal patterns:
Morning Star
A morning star is a 3 candlestick charting patternthat appears during a downtrend. It contains a long bearish candle followed by a small candle; it can be bullish or bearish. However, a bullish candle appears when there is a strong probability of a bullish reversal. And the third candle is bearish, which is usually longer than the first one.
Bullish Engulfing
It’s a two-candle technical analysis pattern. Where the first candle is small bearish and the second candle is large bullish. As the name suggests, the second candle completely engulfs the first candle. The pattern indicates a potential shift from bearish to bullish momentum.
Hammer
Hammer is a one-candle bearish reversal pattern. A hammer candle appears at the end of the downtrend and indicates the formation of green candles. It has a small body that shows a little difference between the opening and closing prices. It has a long lower shadow that is at least double the body.
Inverted Hammer
Inverted Hammer looks opposite to a hammer and has almost same properties. Inverted hammer also appears at the bottom of a downtrend, usually green in color. However, it has a long upper wick that is at least twice the body size.
Double Bottom
Have you ever identified a W-shaped structure on the chart? That is a double bottom pattern. Under this, the price falls twice and reverses back, touching the same laws that act as a support. Traders usually take a buy position when the price, after touching the support, reverses and breaks above the resistance.
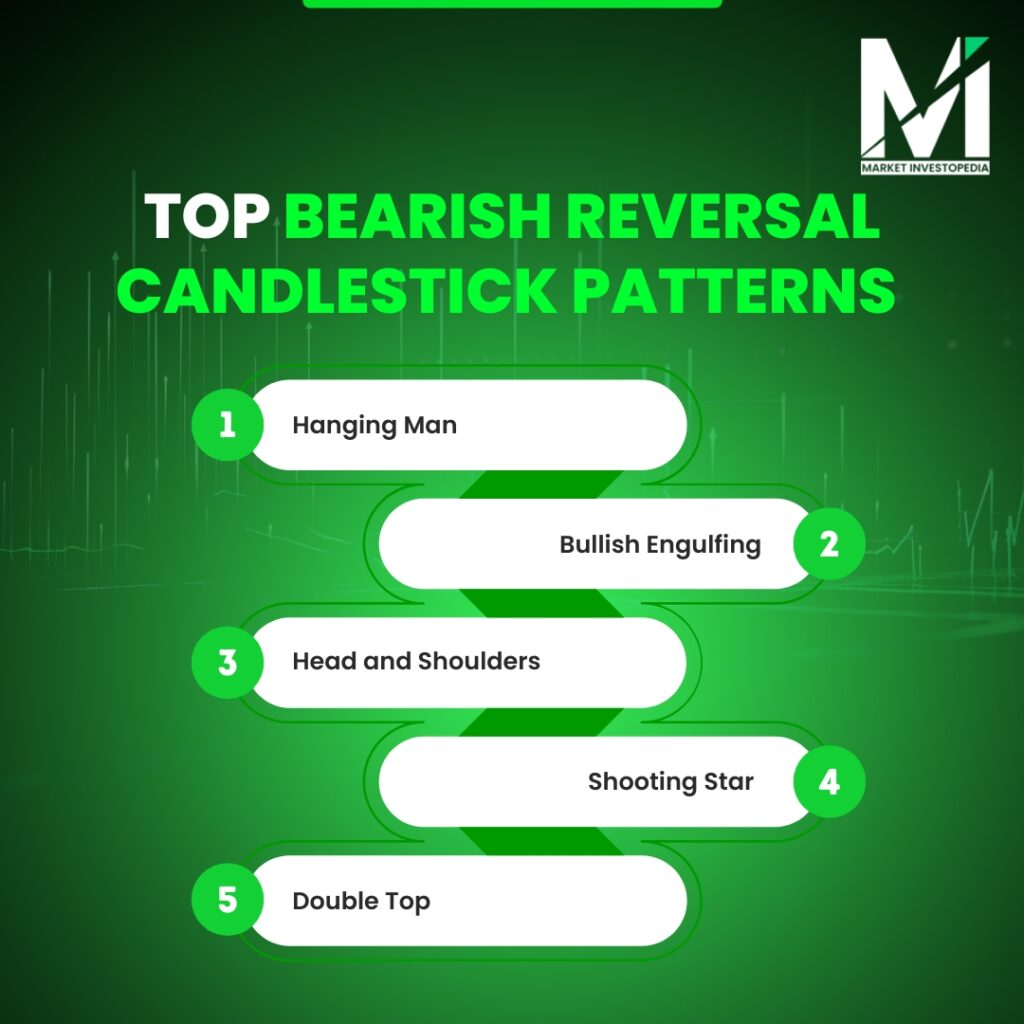
Top Bearish Reversal Candlestick Patterns
A bearish reversal generally occurs when buyers are controlling the market. However, the seller entered and managed to push the price downward.
Bearish reversal candles suggest a potential for reversal from an uptrend to a downtrend, suggesting traders open a sell position. Here are the top bearish reversal patterns:
Hanging Man
Hanging manforms at the top of the uptrend. It has a small body and a long lower shadow. A bearish hanging man candle suggests that there is a strong potential for a downtrend reversal.
Bullish Engulfing
The structure is the same as the bullish engulfing, only the candlestick color makes the difference in interpretation. It also consists of a two-candle pattern where the first candle is small bullish and the second candle is large bearish. The second candle completely engulfs the first candle, suggesting a shift from bullish to bearish momentum.
Head and Shoulders
Head and shoulders is a bearish reversal pattern with three peaks. The side peaks are generally of the same height, while the middle peak is slightly higher. At the end of formation, when the price breaks the support or neckline of the pattern, it suggests that prices are expected to fall.
Shooting Star
A shooting star is a pattern that suggests a temporary bearish reversal. Traders can take advantage of short-term selling opportunities by watching it. It has a small body and a longer upper wick and no lower wick. It forms at the end of the uptrend and is usually of red color, suggesting the start of a downtrend.
Double Top
A double top forms an M-shaped structure on the chart. Under this, the price rises twice, reaches the same peak, and then reverses. Traders usually take a sell position when the price, after touching the resistance the second time, falls and breaks below the support.
Bottom Line
Reversal candle patterns can serve as a useful guide to identify buy or sell opportunities. They can even provide clear trade entry, exit points, and stop loss levels. In addition, they are pretty easy to identify and interpret. You just need the basic technical analysis knowledge.
However, the patterns also have some limitations. They can even generate false signals, and may not be sufficient to make the trade decisions. Thus, proper knowledge is vital for interpreting the patterns correctly.
You can explore our educational blog section to get a detailed understanding of the above patterns. Also, to seek practical guidance, you can even contact us and get assistance from our experienced research team.