Top Forex Indicators Every Pro Trader Uses
Forex indicators are tools that help traders understand what the market is doing. They convert complicated price information into easy-to-read signals.
As a new trader, you can use indicators such as Moving Averages, RSI, and MACD to tell you the trend, momentum, and potential entry or exit points.
They simplify trading by enabling you to identify trends, when the market is overbought or oversold, and validate your trade ideas.
You will be able to trade more confidently and make fewer guesses with the right indicators.

A quick glance
Algorithm Trading is a strategy for buying or selling a financial asset using automated bots or robots based on predefined rules.
Algo trading strategies are widely applicable to forex, cryptocurrencies, stocks, indices, commodities, ETFs, and other financial Markets.
Coursera, Udemy, Oxford, Investing.com, Market Investopedia, Baby Pips, Investopedia, Trading Academy, Trading View, LinkedIn Learning, Google Cloud courses, and SkillShare are some popular platforms to get algo trading online courses.
- To Get Technical Knowledge
- To Deal with Complexity
- Proper Execution & Customization
- For Managing Glitches
- Effective Backtesting
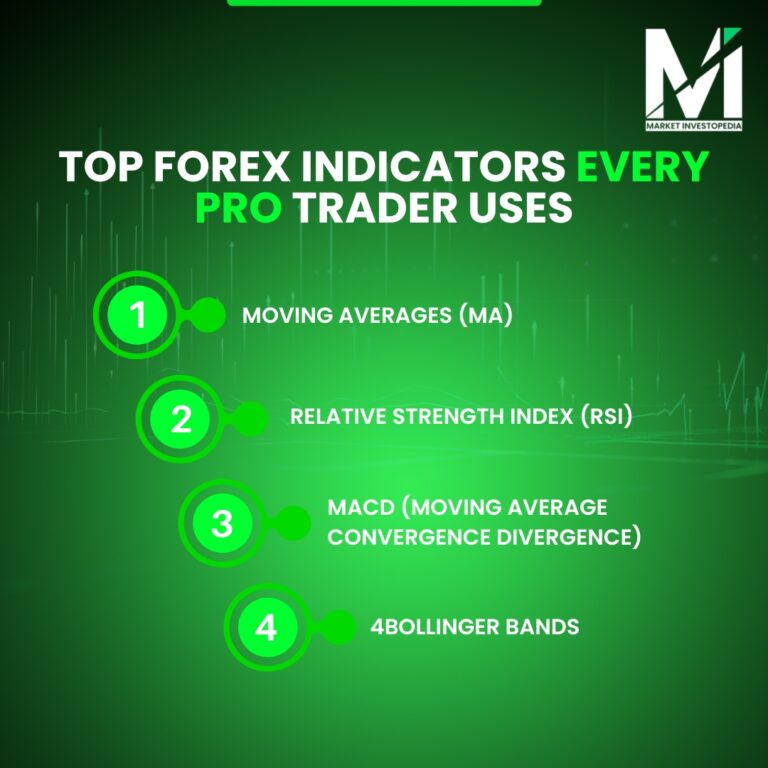
Indicator #1 – Moving Averages (MA)
One of the most popular and easy-to-use forex indicators is Moving Averages (MAs), which can be used by any novice. In essence, they filter the price data over time, i.e. rather than seeing all the jumps, you get a better picture of the trend.
It has two principal types:
- Simple Moving Average (SMA): It calculates the average of the closing prices of a specific number of days, and plots a line that indicates the general trend.
- Exponential Moving Average (EMA): It places more emphasis on the recent prices and thus responds quickly to changes.
Why Moving Averages Work for Beginners
When the price line is above the MA line, it is usually an indication of an upward trend; when it is below, it is usually an indication of a downward trend. It becomes simpler to identify market trends, which is a major component of forex trading as a beginner.
Using Crossovers as Signals
The Moving Average crossover is one of the most popular tricks: a fast MA (e.g. the 10-day EMA) crossing above a slower MA (e.g. the 50-day SMA) can be a buy signal. And when it crosses down, that can be a sell or exit signal- this provides clear, easy-to-read entry and exit signals.
In general, the Moving Average is a potent but easy-to-use tool for forex novices. It will minimise guesswork, keep your trades in line with the trend, and is an ideal basis to build on with other indicators in the future.
Indicator #2 – Relative Strength Index (RSI)
One of the simplest forex indicators that a beginner can learn is the Relative Strength Index (RSI). It is a measure of the speed and amount of movement of the price of a currency pair. The outcome is presented as a figure between 0 and 100.
An RSI above 70 can be an indication that the market is overbought- the prices might be too high and may fall shortly. When it is less than 30, it is typically an indication that the market is oversold-prices might be too low, and they might increase.
Why Traders Like RSI
The RSI provides fast, visual indications of whether buying or selling pressure is intense. This assists in determining potential reversals or confirming your trade set-up.
How Beginners Can Use RSI
When you notice RSI above 70, you may wait to purchase or think of a sell trade. When it is less than 30, it may be an opportunity to purchase. RSI is also used by many traders in combination with other indicators, such as Moving Averages, to obtain a more powerful confirmation.
Easy to read and efficient, RSI is an excellent tool to assist you in making smarter and more confident trading decisions.
Indicator #3 – MACD (Moving Average Convergence Divergence)
Another popular and powerful forex trading indicator is the MACD. It assists traders to view the direction of the trend and the strength of the trend. The MACD is a comparison of two moving averages of varying speeds and displays the difference between the two.
It consists of two major sections:
- MACD Line and Signal Line– These lines overlap to provide buy or sell signals.
- Histogram– A bar graph that indicates the strength of the trend.
Why MACD is Useful for Beginners
When the MACD line crosses over the signal line, it is a buy signal. When it goes below, it may be a sell signal. The histogram is useful for you to quickly determine if the market momentum is increasing or decreasing.
How to Use MACD in Forex Trading
MACD can be used by beginners to verify the market direction and prevent trading against the trend. It is often used in combination with RSI or Bollinger Bands by many traders to achieve even greater accuracy.
MACD is simple to read, gives clear signals and can greatly improve your forex trading strategy.
Indicator #4 – Bollinger Bands
Bollinger Bands are a common forex indicator that assists traders in gauging the volatility of the market and identifying potential trade setups. They are made up of three lines: a middle line (usually a moving average) and two outer bands that expand and contract with market action.
When the bands are far apart, this indicates that the market is highly active and prices are fluctuating a lot. When the bands are narrow, this indicates that the market is quiet and the price movement is less.
How Traders Use Bollinger Bands
When the price reaches or crosses the upper band, the market may be overbought and may reverse down. When it reaches the lower band, the market may be oversold and may rebound up.
Why Bollinger Bands Are Good for Beginners
They provide a visual representation of whether the market is quiet or turbulent, and where the price may turn. Most traders use Bollinger Bands in conjunction with RSI or MACD to validate entry and exit levels.
Bollinger Bands are simple to interpret and can assist you in making more informed decisions in your forex trading strategy.

Tips for Using Forex Indicators the Right Way
Consider forex indicators as your trading guide- they guide you, but you must have your own judgment. Combine two or three indicators to get stronger signals and make your charts simple to understand. Never trade without testing a new strategy on a demo account, and never forget risk management, set stop-losses and exit plans before entering a trade.
In forex, learning is continuous. Sites such as Market Investopedia are excellent to learn strategies and keeping up with market trends.
In case you have any questions or need more trading tips that are easier to understand, simply reach out to us via our site. We are always glad to help you develop a more intelligent, more confident attitude toward the markets.

