
01 Key News Insights
Date: 25th, March, Wednesday, 2026
Daily Economic Outlook:
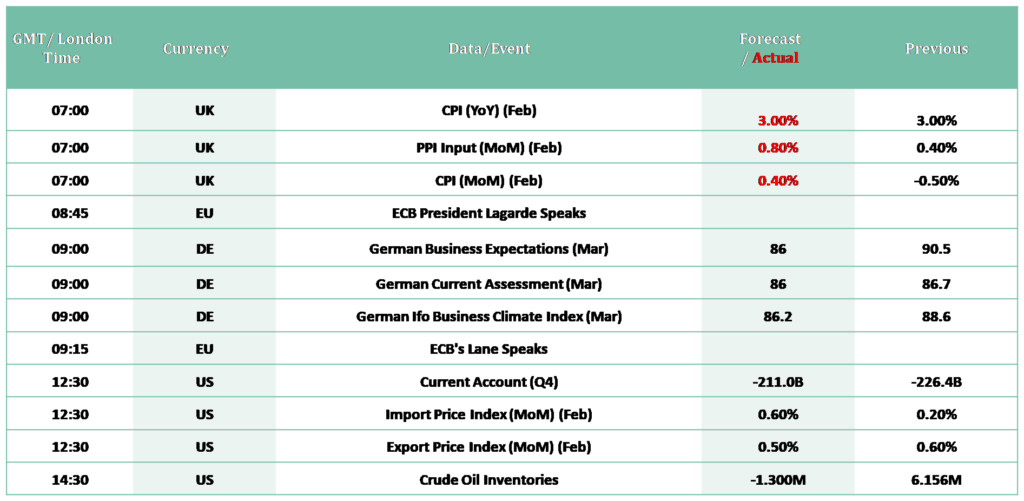
UK Inflation Rate Steady at 3%
- The annual inflation rate in the UK steadied at 3% in February 2026, the same as in January and in line with expectations.
- Prices normally rise in February as the spring product ranges start to enter the shops.
US-Israel & Iran War Update: Trump’s 15-Point Proposal of De-escalation
1.The US, alongside regional partners, proposed a 15-point plan aiming to de-escalate the conflict.
2.This includes dismantling elements of Iran’s nuclear program, ceasing support for regional proxy groups, and reopening the Strait of Hormuz.
3.While Iran has reportedly denied direct talks, creating volatility in oil prices.
4.The conflict has caused significant disruption to oil supplies, with Brent crude topping $110 at peak, threatening to trigger a “stagflationary shock” and a percentage point reduction in global growth.
Crucial Headlines – Mar 25th
- Diplomatic efforts are underway to establish a one-month ceasefire mechanism between the United States and Iran, according to reports.
- Apple Inc. is planning an AI overhaul with a standalone Siri app, a new “Ask Siri” feature, and updates set for iOS 27 and unveiling on June 8.
- SpaceX may file for an IPO as soon as this week, aiming to raise over $75 billion in one of the largest listings of the year.
The Dollar Index (DXY)
- US Dollar Index holds above 99.00 as US-Iran talks stir uncertainty
- DXY struggled amid reports that Washington is pursuing talks with Iran to de-escalate the conflict.
- Trump said Iran offered a goodwill gesture in talks linked to Strait of Hormuz energy flows.
- Fed’s Goolsbee said rate cut outlook remains uncertain, depending on conflict duration and inflation progress.
EUR/USD
- EUR/USD remains subdued for the 2nd successive day, trading around 1.1600.
- The pair stays defensive as the US Dollar finds fresh haven demand as Iran continues to strike US bases in Gulf countries
- Although reports suggest that the US is actively pursuing diplomatic engagement with Tehran to de-escalate the ongoing conflict.
USD /JPY
- The USD/JPY pair edges higher to around 159.00 during the early European trading hours on Wednesday.
- JPY weakens due to surging energy prices.
- Traders will closely monitor the developments surrounding US-Iran peace talks.
GBP/USD
- GBP/USD is holding mild losses below 1.3400 in European trading on Wednesday
Even though the UK CPI data came broadly in line with estimates for February.
01 - Instructions/ Guidelines for Executing Suggested Trades
- Close your trades within 8-10 hours or before 6:30 PM UTC (midnight IST), regardless of profit/ loss.
2. By chance, if you face losses in your “Primary Trade”, the “Alternative Call” is designed to recover those losses.
3. That’s why, always place the “Alternative call” alongside the “Primary Call”.
4. In case the “Alternative or Recovery Call” doesn’t get triggered the same day, a new call (or signal) will be provided the following day.
5. Generally, the Global Market Outlook Report includes signals with a higher reward-to-risk ratio (from 2:1 and higher). Therefore, consider booking partial profits in steps as follows:
a. For example, if the reward is two times the risk (or 2:1), consider booking half (or 50%) of the profit when levels reach a 1:1 ratio, and maintain the remaining position.
b. Then, when prices reach twice the risk (2:1), book the remaining 50% position.
c. To make this process seamless and smooth, consider placing two calls simultaneously with the same Stop-Loss (SL) and Entry-Level but different Target-Levels.
Note: These guidelines aim to optimize your trading strategy while managing risks effectively.
02 - Economic Calender
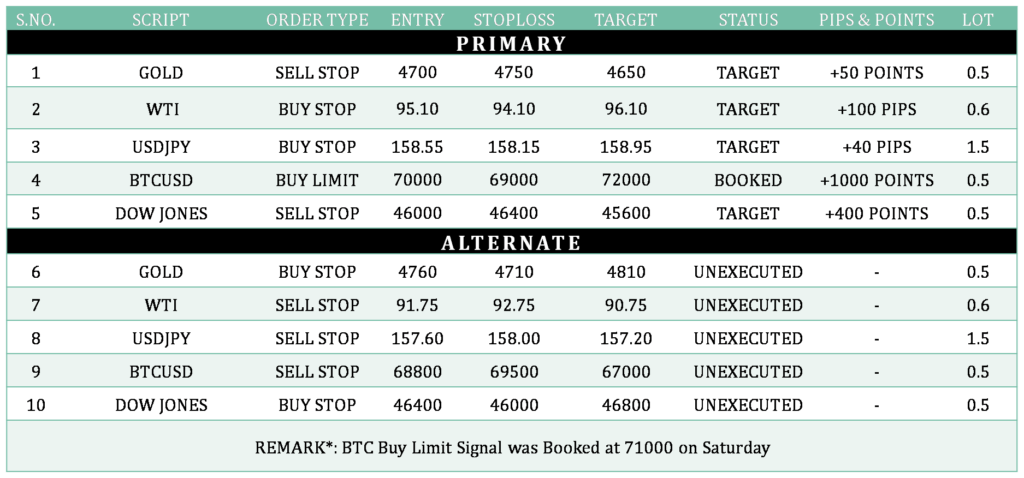
03 - Previous Day Performance
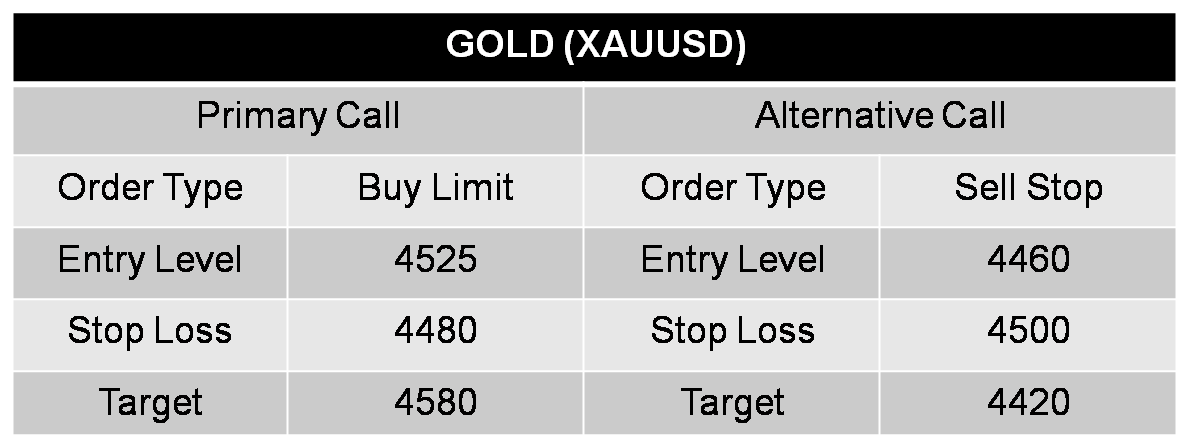
04 - Gold Analysis
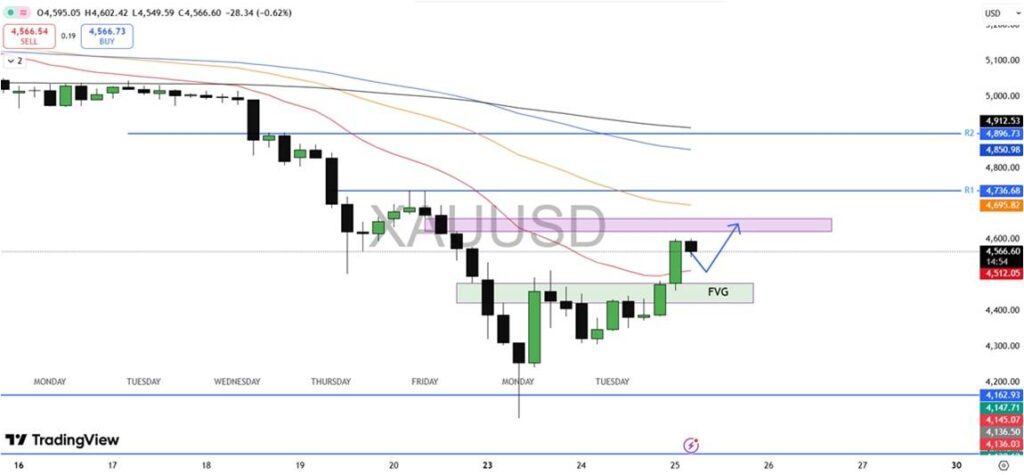
Overview: After sweeping December lows, gold is showing signs of a bottom with a strong reversal from the lows. It can now move toward the 4600–4650 resistance zone, where a bearish FVG and the 100 EMA are placed. With prices already up around 2%, the plan is to wait for a dip—likely around the London open—and look for buying opportunities.
Biasness: Gold prices climbed over 2% in Asian trading on Wednesday, supported by a drop in oil prices and a weaker U.S. dollar, as reports of a potential Middle East ceasefire reduced inflation concerns and boosted the metal’s appeal.
Key Levels:
R1- 4736 R2- 4896
S1- 3999 S2- 4162
Data Releases: With today’s key U.S. releases—including Current Account and Import Prices m/m—gold price volatility during the New York session is expected to remain relatively subdued.
Technical Analysis: The price is holding above 21 & 50 EMA on the 1H timeframe, with the EMA slope trending upward, indicating a bullish bias.
Alternative Scenario: If prices starts to close below 21 & 50 EMA on 1H timeframe & closes below 4400 then we can plan short entries.
While writing the report, gold is trading at 4566.
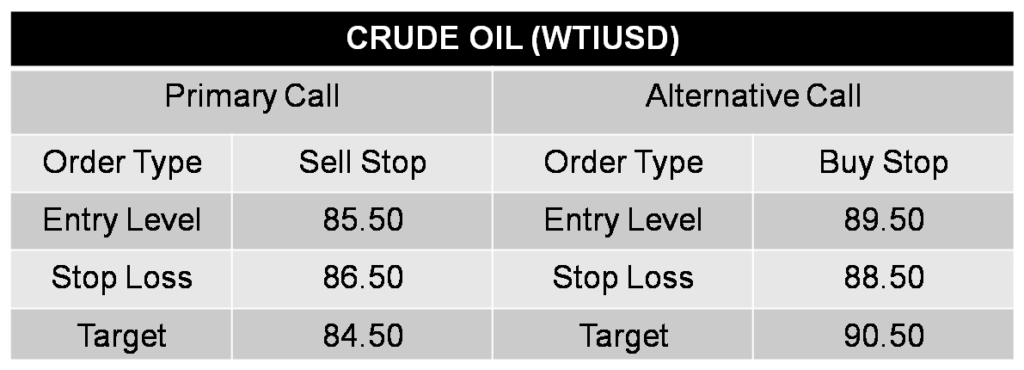
05 - Crude Oil
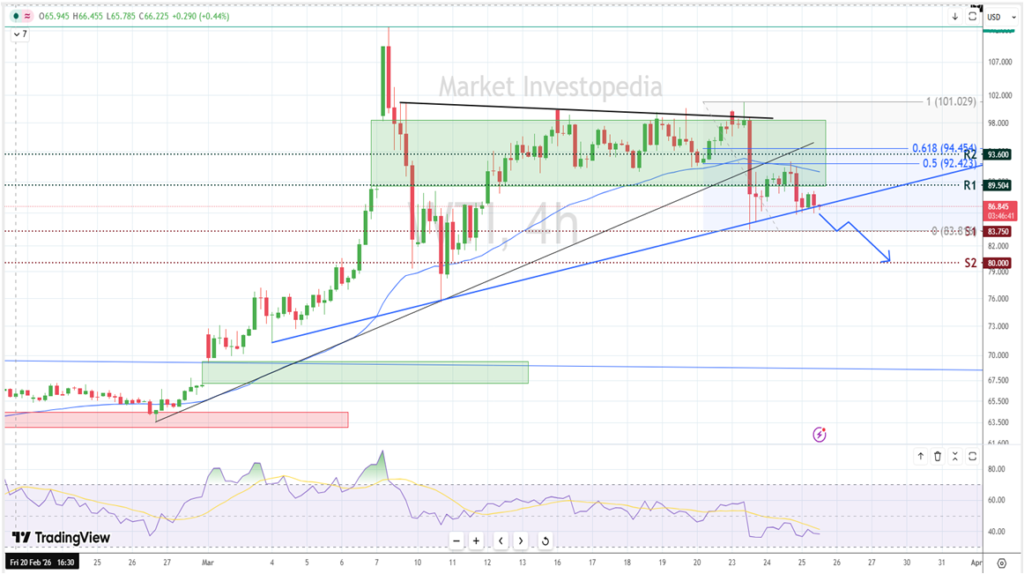
Overview: Crude Oil prices have given a bearish breakout of the ascending triangle pattern, and the prices are currently testing the blue ascending line support. The prices are expected to continue the bearish trend, and if prices breaches the blue trendline and sustain lower, then prices might fall lower towards mentioned support level.
Biasness: Oil price gains ground after two days of losses, trading around $88.00 per barrel. However, crude oil prices eased as supply concerns began to fade following reports that the US had put forward a proposal aimed at ending the conflict.
Key Levels:
R1: 89.50 R2: 93.60
S1: 83.75 S2: 80.00
Data Releases: Today’s key U.S. releases includes Current Account and Import Prices m/m—oil price volatility during the New York session is expected to remain relatively subdued.
Technical Analysis: The prices are trending in the selling zone of the technical indicators.
Alternative Scenario: Only a sustainable breakout above R1 (89.50) might drive oil prices higher to far resistance zone.
While writing the report, the pair is trending at 88.00
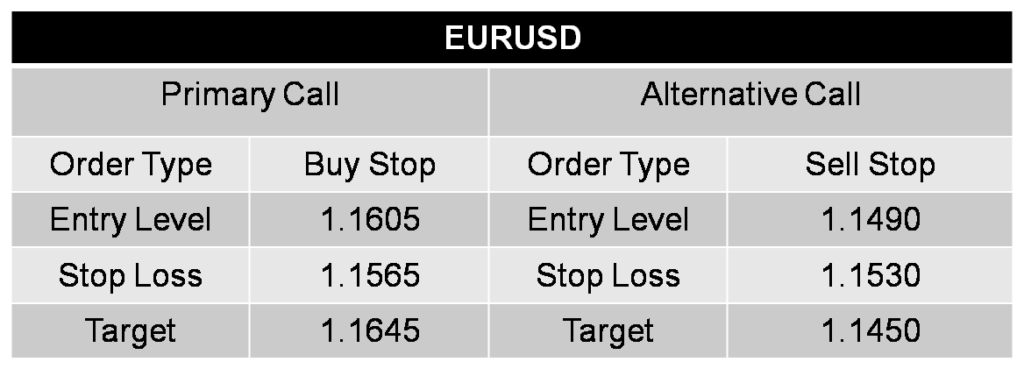
06 - EUR/USD
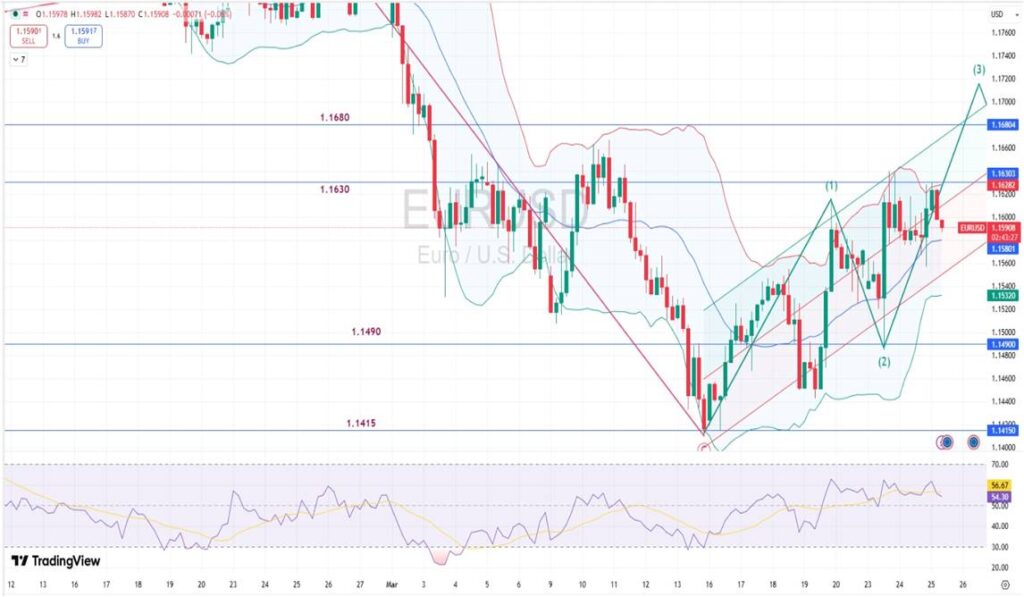
Overview: EUR/USD is showing a bullish structure after holding strong above the 1.1490 support zone. Price is forming higher lows and gradually pushing higher, indicating improving buying strength.
Biasness EUR/USD may move slightly higher as hopes of US–Iran talks reduce safe-haven demand for USD, supporting the Euro. ongoing Middle East tensions still limit upside by keeping USD demand strong. ECB rate hike expectations support EUR, helping balance downside pressure.
Key Levels:
R1: 1.1630 R2: 1.1680
S1: 1.1490 S2: 1.1415
Data Release EUR may get support if German Ifo and ECB Lagarde sound positive, signaling improving outlook or tighter policy. USD will react to Fed comments and inflation-related data; hawkish tone or strong data supports USD, while weaker data can pressure it.
Technical Analysis Price is holding above the moving average and maintaining an upward trendline. The recent pullback looks corrective. RSI is near mid-levels and turning slightly higher, showing recovering momentum. Price may move toward 1.1590, and if buying continues, 1.1665.
Alternative Scenario: If price breaks below 1.1490, it can move toward 1.1415, weakening the bullish view.
While writing the report, the pair is trending at 1.1590.
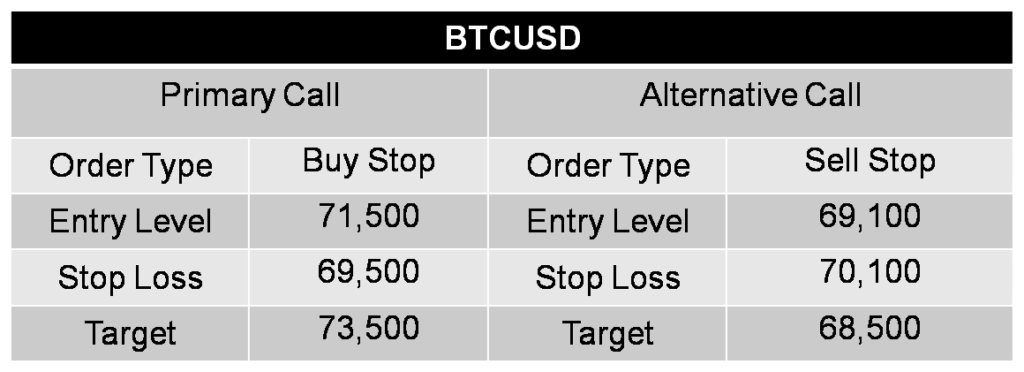
07 - BTC/USD
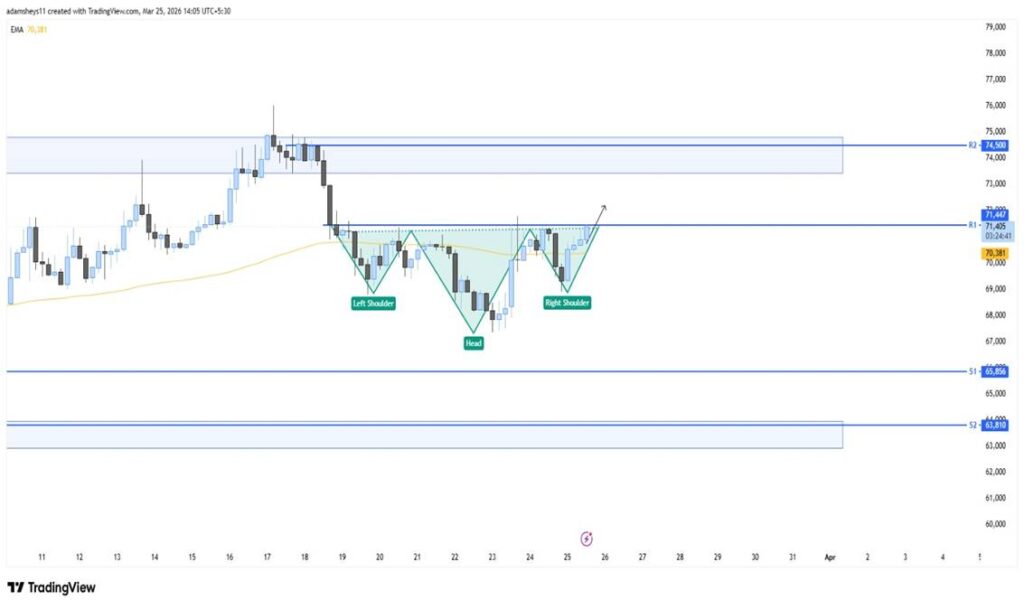
Overview: Bitcoin is forming a potential inverse head and shoulders pattern, indicating a shift from bearish to bullish structure. Price is currently testing the neckline resistance around 71,400–71,600, with repeated rejections but strong attempts to break higher. The structure suggests accumulation after a corrective phase, with buyers gradually gaining control.
Biasness: Bitcoin demonstrates resilience trading near $71,000 despite escalating Middle East tensions and Fed rate hike fears, with Bernstein analysts calling a price bottom and reaffirming a $150,000 year-end target driven by ETF inflows and corporate adoption.
Key Levels:
R1 : 71,447 R2 : 74,500
S1 : 65,856 S2 : 63,810
Data Release: Import Price Index, Export Price Index, and Cushing Crude Oil Inventory data are scheduled today. These are medium-impact events, which may influence USD sentiment and commodity-linked volatility, but are unlikely to drive major directional moves unless data deviates significantly.
Technical Analysis: Price is trading near the 50 EMA (~70,300) and consolidating just below the neckline resistance. The inverse head and shoulders formation signals potential bullish reversal, with a breakout above 71,600 likely to push price toward 74,500. Momentum is building as higher lows continue to form.
Alternative Scenario: Failure to break above the neckline may result in continued consolidation or a pullback toward 65,856 (S1). A breakdown below this level would invalidate the bullish structure and expose 63,810 (S2).
While writing the report, the pair is trending at 70,368.
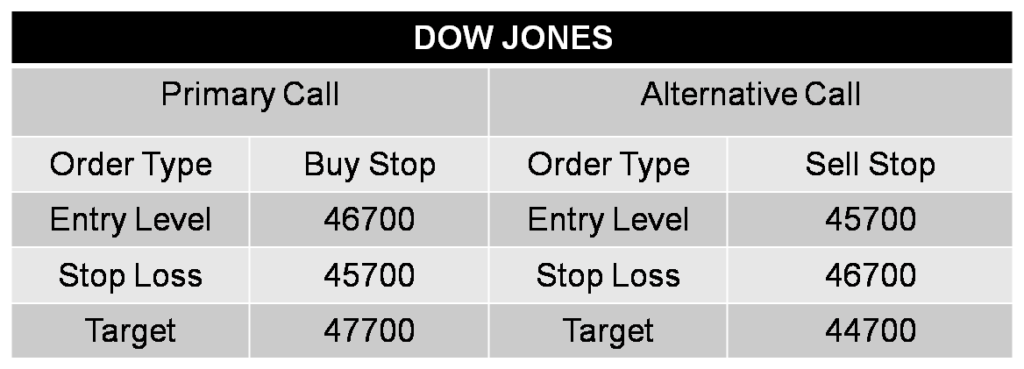
08 - DOW JONES
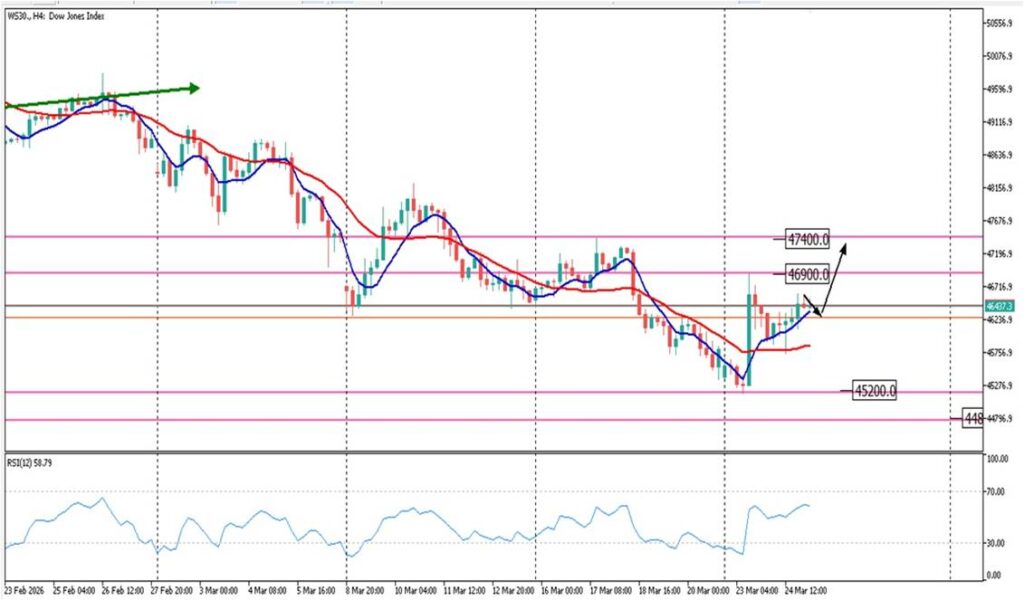
Overview: The primary trend of the Dow Jones was bearish, but the structure has shifted as prices begin forming higher lows. Currently testing the previous high, a brief correction is expected before a breakout; a sustained move above it could signal further bullish momentum.
Biasness: The Dow Jones traded with volatility as geopolitical tensions and rising oil prices pressured sentiment, while weak Treasury auction results and declines in major stocks like Salesforce and IBM weighed on the index despite brief recovery attempts.
Key Levels:
R1: 46900 R2: 47400
S1: 45200 S2: 44800
Data Release Today, key U.S. releases include the current account, import and export price indices, and the 5-year note auction. If the auction yield comes in below 3.615%, it may weaken the dollar and support further upside in the Dow Jones.
Technical Analysis: 12 period EMA is above of 52 period EMA indicating bullishness in prices.
Alternative Scenario: If prices are able to breach the immediate support level and if 12 period EMA crosses below of 52 period then further bearishness can be seen.
While writing the report, the pair is trending at 46412.
10 - Disclaimer
- CFD trading involves substantial risk, and potential losses may exceed the initial investment.
- Signals and analysis are based on historical data, technical analysis, and market trends.
- Past performance does not guarantee future results; market conditions can change rapidly.
- Consider your risk tolerance and financial situation before engaging in CFD trading.
- Signals are for informational purposes only and not financial advice.
- Each trader is responsible for their decisions; trade at your own risk.
- The report does not consider individual financial situations or risk tolerances.
- Consult with financial professionals if uncertain about the risks involved.
- By accessing this report, you acknowledge and accept the terms of this disclaimer.
Safe trading,
Market Investopedia Ltd