
Key News Insights
Date: 17th, June, Tuesday, 2026
Daily Economic Outlook:
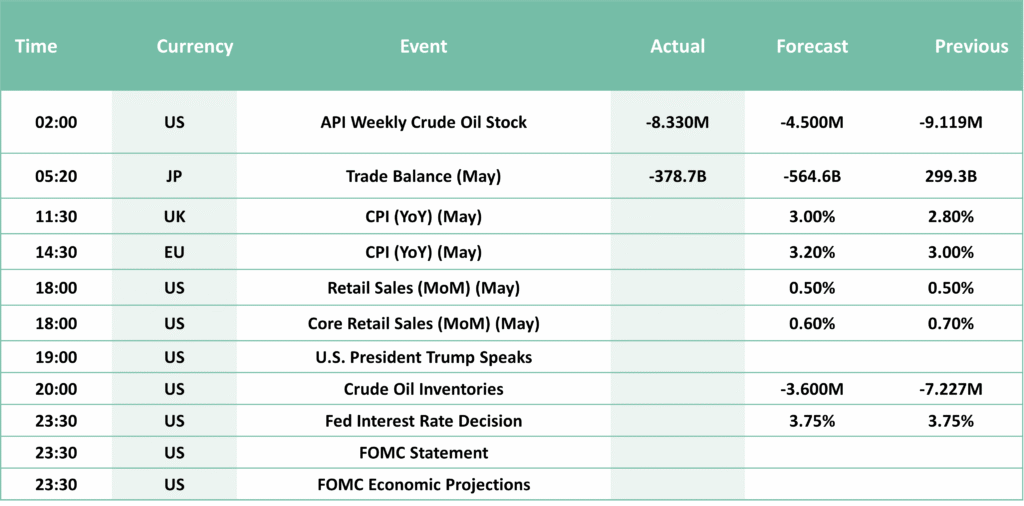
Key Events This Week:
- Retail Sales (MoM) (May)
- Core Retail Sales (MoM) (May)
- U.S. President Trump Speaks
- Crude Oil Inventories
- Fed Interest Rate Decision
- FOMC Statement
All eyes are on the Fed & Kevin Warsh today.
Fed rate decision and revised dot plot to ramp up volatility
- No change expected in rates.
- Fed likely on extended pause.
- Words not Dots matter at this meeting.
- Will Warsh override forward guidance?
- Trump’s reaction.
Retail investors are aggressively accumulating SpaceX stocks:
- On Monday alone, retail investors purchased +$93.8 million of $SPCX shares, accounting for ~73% of all retail single-stock purchases during the day.
- In the first 10 minutes of Monday’s session, retail investor turnover in the stock exceeded $7 million.
- Retailers’ risk appetite is showing no signs of slowing down.
Central banks remain highly bullish on gold, with a record 45% planning to increase their gold holdings over the next 12 months.
The Dollar Index (DXY)
- After posting marginal losses on Tuesday, the US Dollar (USD) Index holds steady at around 99.50 on Wednesday.
- Markets widely expect the Fed to leave its monetary policy settings unchanged.
EUR/USD
- EUR/USD moves sideways slightly above 1.1600 after posting small gains for two consecutive days.
GBP/USD
- GBP/USD loses traction and returns to the red toward 1.3400 in European trading on Wednesday.
- The UK monthly Consumer Price Index (CPI) inflation eased to 0.2% in May from 0.7% in April, missing expectations for a 0.4% figure.
- Slowing inflation in the UK weighs on BoE rate hike bets and the British Pound.
USD/ JPY
- The Japanese Yen failed to benefit from the Bank of Japan’s decision to raise the policy rate by 25 basis points on Tuesday and ended the day marginally lower against the USD.
- USD/JPY fluctuates in a narrow range above 160.00 in the European morning on Wednesday.
AUD/ USD
- AUD/USD struggles to gain traction and trades at around 0.7050 following Tuesday’s choppy action.
01 - Instructions/ Guidelines for Executing Suggested Trades
- Close your trades within 8-10 hours or before 6:30 PM UTC (midnight IST), regardless of profit/ loss.
2. By chance, if you face losses in your “Primary Trade”, the “Alternative Call” is designed to recover those losses.
3. That’s why, always place the “Alternative call” alongside the “Primary Call”.
4. In case the “Alternative or Recovery Call” doesn’t get triggered the same day, a new call (or signal) will be provided the following day.
5. Generally, the Global Market Outlook Report includes signals with a higher reward-to-risk ratio (from 2:1 and higher). Therefore, consider booking partial profits in steps as follows:
a. For example, if the reward is two times the risk (or 2:1), consider booking half (or 50%) of the profit when levels reach a 1:1 ratio, and maintain the remaining position.
b. Then, when prices reach twice the risk (2:1), book the remaining 50% position.
c. To make this process seamless and smooth, consider placing two calls simultaneously with the same Stop-Loss (SL) and Entry-Level but different Target-Levels.
Note: These guidelines aim to optimize your trading strategy while managing risks effectively.

02 - Economic Calender
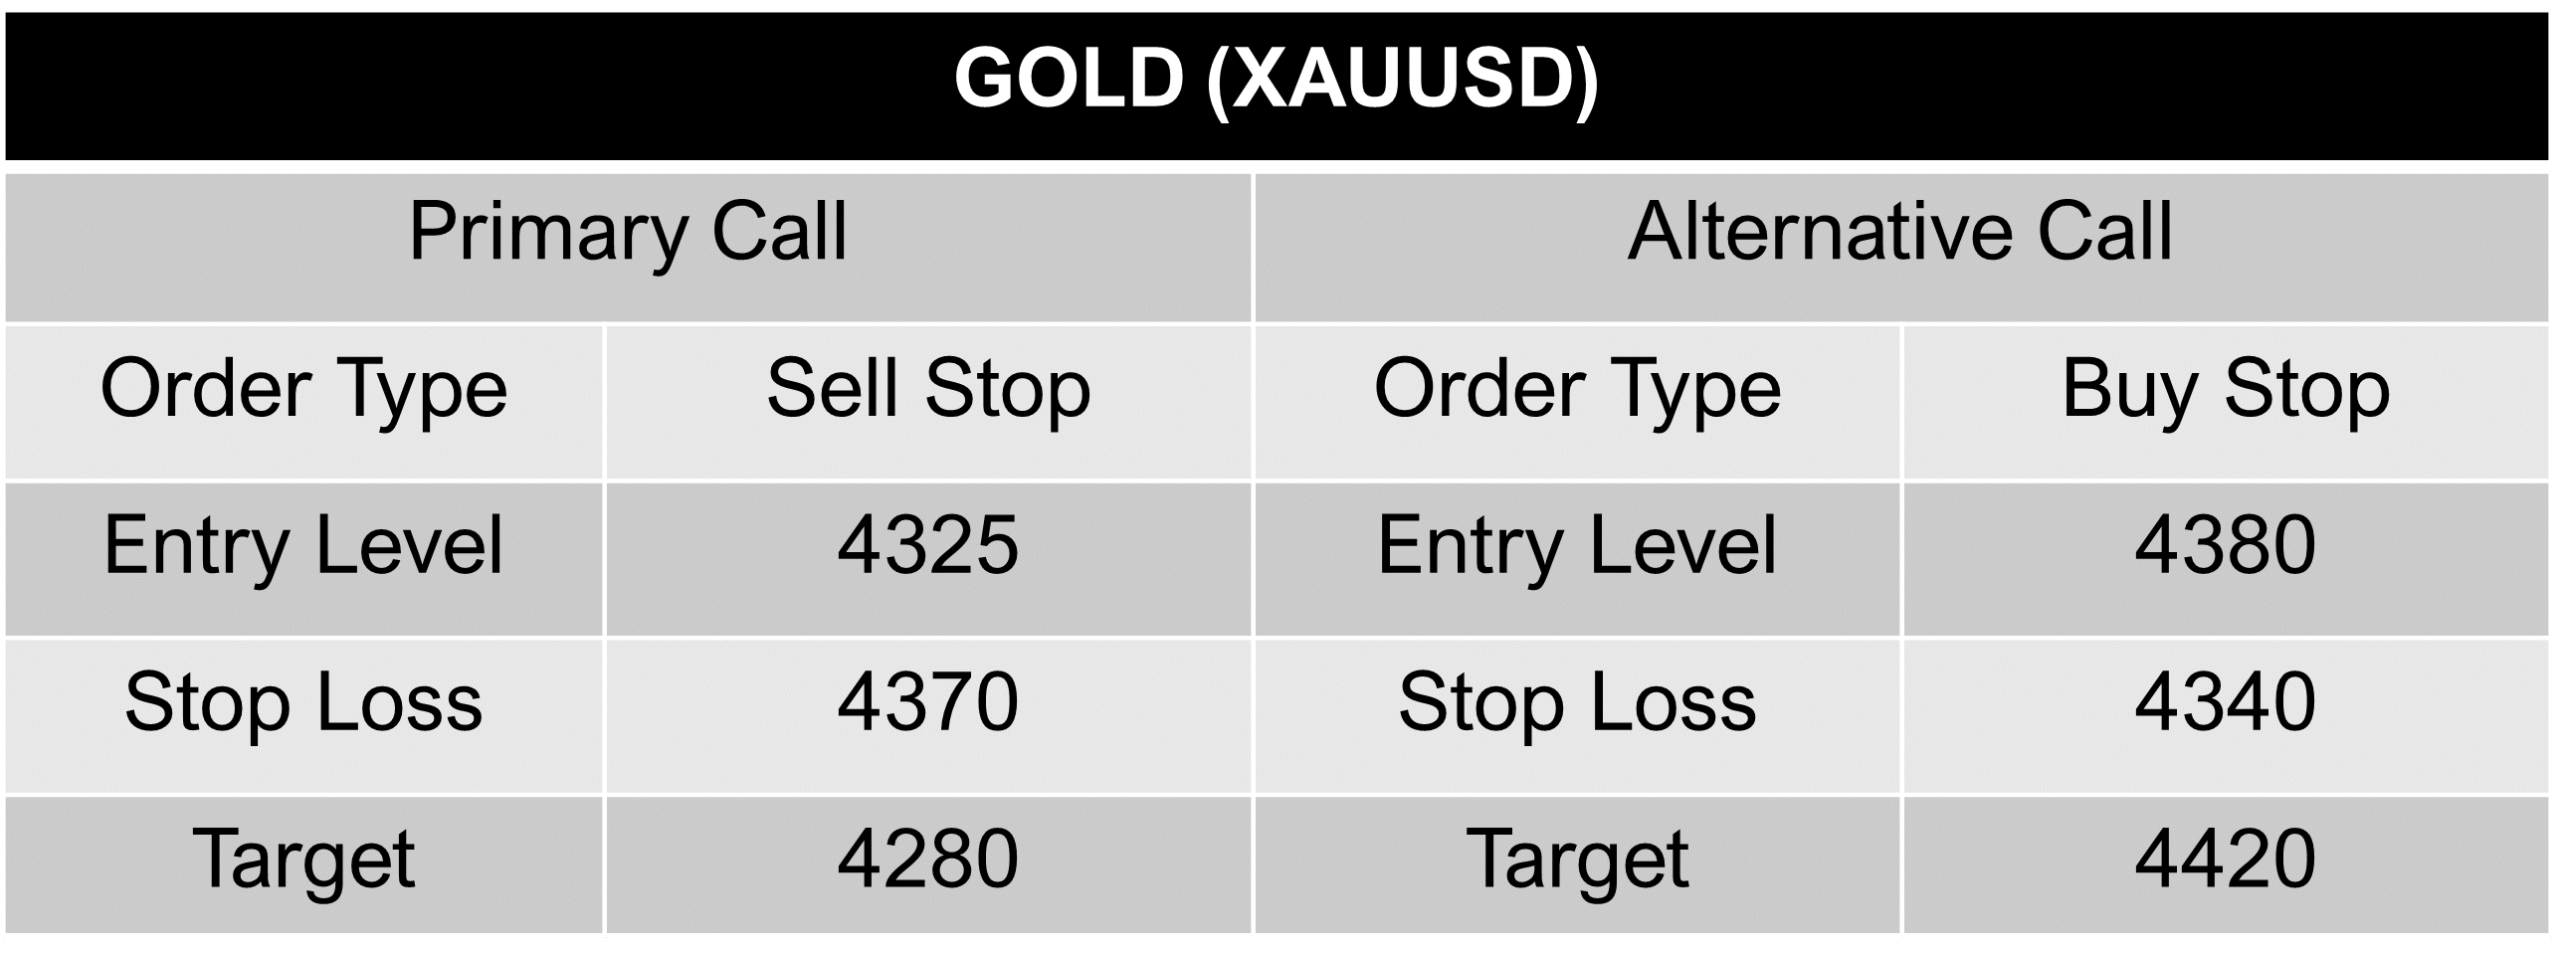
03 - Gold Analysis
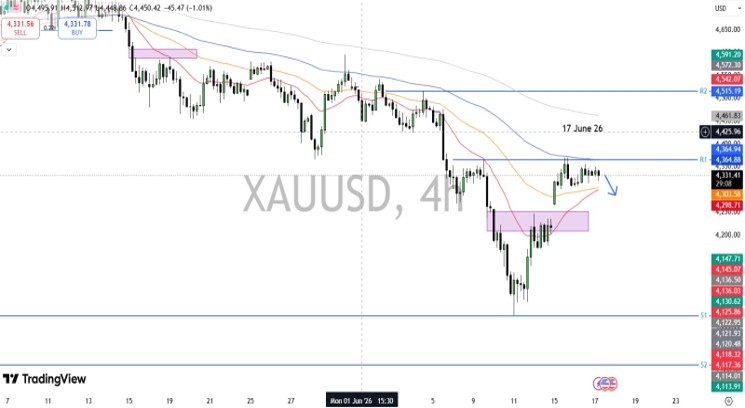
Overview: Gold successfully swept buy-side liquidity around the 4370 level and is now showing signs of a deeper pullback. Price is currently consolidating ahead of the FOMC rate decision, which is likely to be the key catalyst for the next move. The broader bias remains bearish, and any pullback toward the 4340–4350 zone could present an opportunity to establish short positions, with potential downside targets around 4260–4270.
Biasness: Gold prices edged higher in Asian trading on Wednesday, marking a fifth straight session of gains, as an interim U.S.-Iran peace agreement helped ease concerns over energy-driven inflation. Investors now await the outcome of the Federal Reserve’s policy meeting for further direction on interest rates and market sentiment.
Key Levels:
R1- 4364 R2- 4515
S1- 4021 S2- 3917
Data Releases:Today’s key U.S. events include remarks from President Trump, the Federal Funds Rate decision, and Core Retail Sales data. These releases are expected to keep gold prices and broader financial markets moderately volatile during the New York trading session.
Technical Analysis: The price is holding below 100 & 200 EMA on 4H chart with EMA slope trending downward, indicating bearish bias
Alternative Scenario: If prices starts to close above last high on 4H timeframe & closes above 4380 then we can plan long entries.
While writing the report, gold is trading at 4329.
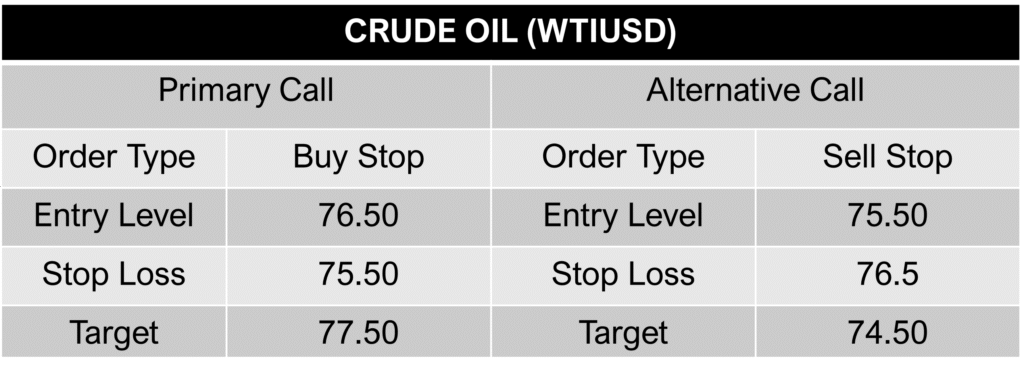
04 - Crude Oil
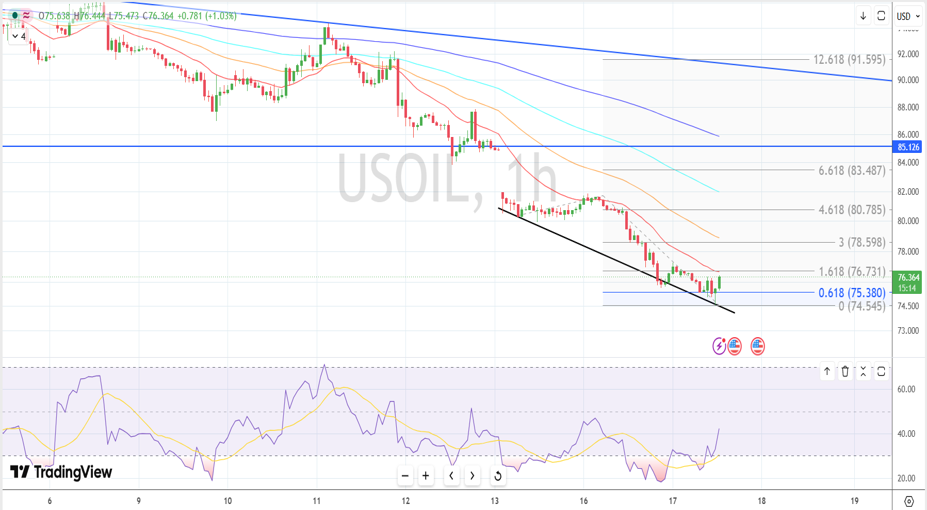
Overview: US Oil trades near $76.35 after a prolonged downtrend. Prices recently tested the 74.50–75.00 support zone and witnessed a technical rebound. However, the broader trend remains bearish as prices continue to trade below the 20, 50, 100 and 200 EMAs.
Biasness: Crude oil remains pressured by concerns over global demand and economic growth. Additionally, expectations of a hawkish Fed stance could strengthen the US Dollar, limiting upside potential in oil despite recent bargain buying near multi-week lows.
Key Levels:
S1: 74.55 S2: 73.00
R1: 76.75 R2: 78.60
Data Releases: Focus remains on the FOMC policy decision, Fed commentary, and the EIA Crude Oil Inventories report, all of which could drive near-term volatility.
Technical Analysis: RSI is rebounding from near-oversold levels, suggesting easing bearish momentum. However, prices remain below all major EMAs, keeping the broader outlook negative.
Alternative Scenario: A break above 76.75 may open the door towards 78.60, while a move below 74.55 could accelerate losses towards 73.00.
While writing the report, oil is trading at 76.35.
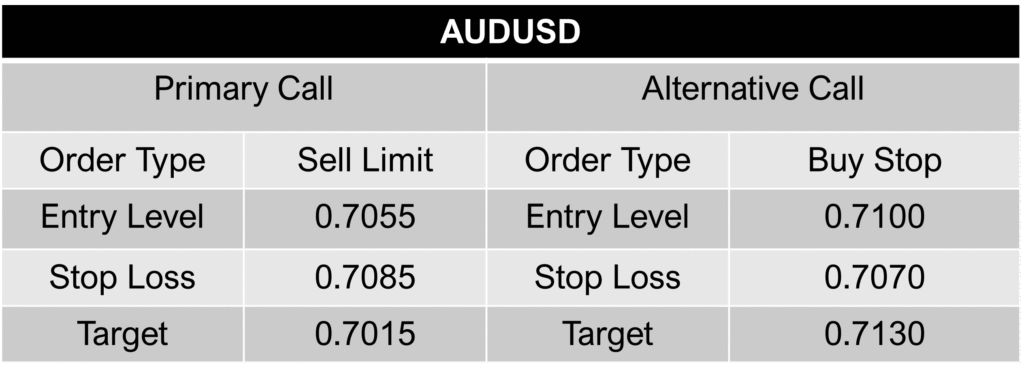
05 - AUD/USD
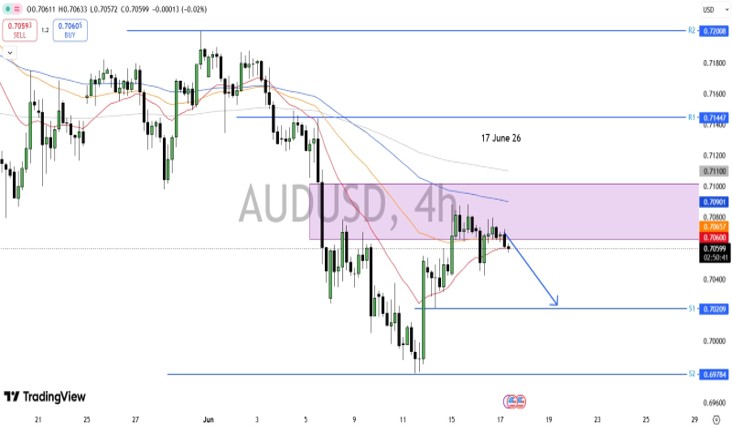
Overview: AUD/USD remains in a bearish trend, with price continuing to form lower highs and lower lows. The pair may sweep sell-side liquidity around the 0.6979 level before its next directional move. Price is currently testing a bearish Fair Value Gap (FVG), and any rejection from this zone could reinforce downside pressure. The overall bias remains bearish as long as price stays below the FVG resistance area.
Biasness: The Australian dollar remained above $0.70 as the RBA maintained a hawkish stance despite keeping interest rates unchanged at 4.35%. Policymakers highlighted ongoing inflation risks and left the door open for further rate hikes, with markets still pricing in the possibility of one additional increase later this year.
Key Levels:
R1: 0.7145 R2: 0.7201
S1: 0.7021 S2: 0.6978
Data Release: Today’s key U.S. events include remarks from President Trump, the Federal Funds Rate decision, and Core Retail Sales data. These releases are expected to keep AUDUSD prices and broader financial markets moderately volatile during the New York trading session.
Technical Analysis: The price is holding below 100 & 200 EMA on 4H chart with EMA slope trending downward, indicating bearish bias
Alternative Scenario: If prices starts to close above last high on 4H timeframe & closes above 0.7095 then we can plan long entries.
While writing the report, the pair is trending at 0.7060.
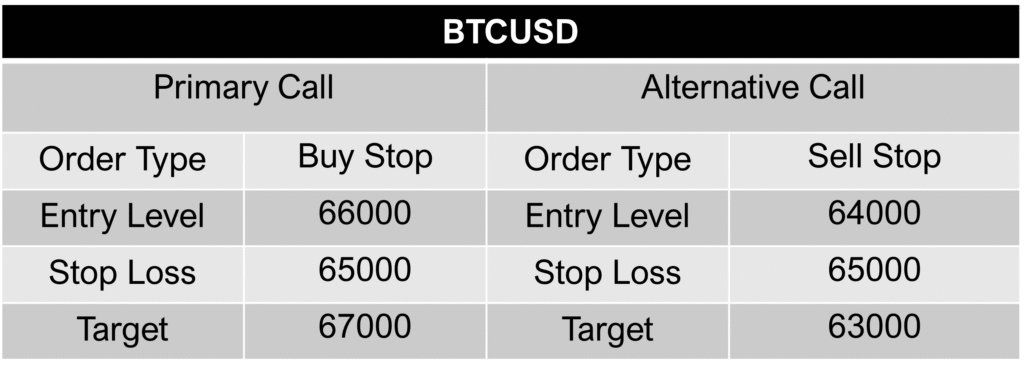
06 - BTC/USD
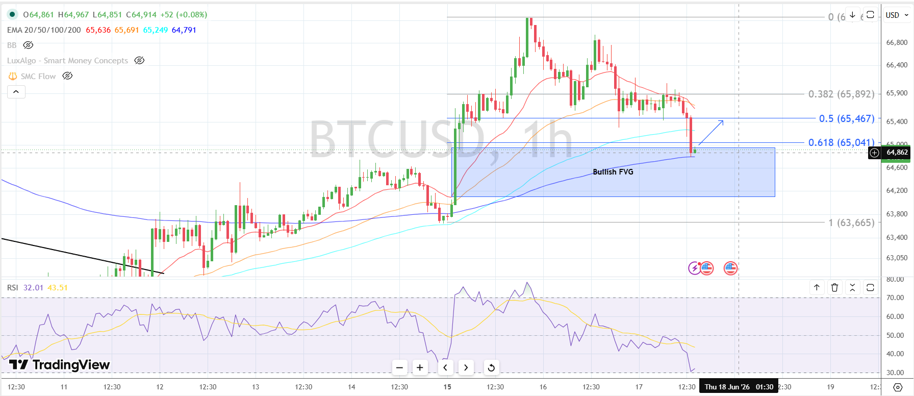
Overview: Bitcoin trades near $64,860 after witnessing a sharp rejection from the $66,900 region. Prices have declined towards the 61.8% Fibonacci retracement level and are currently testing a key demand zone supported by a Bullish Fair Value Gap (FVG) and the 200 EMA. While the broader uptrend remains intact, short-term momentum has turned bearish.
Biasness: Bitcoin remains supported by institutional adoption and long-term bullish sentiment. However, traders remain cautious ahead of the FOMC policy decision, as a hawkish Fed stance could strengthen the US Dollar and pressure risk assets, including cryptocurrencies.
Key Levels:
S1: 64,200 S2: 63,665
R1: 65,470 R2: 65,900
Data Releases: Focus remains on the FOMC policy decision and Fed commentary. Any signals regarding the future path of interest rates could significantly impact risk sentiment and Bitcoin’s near-term direction.
Technical Analysis: RSI has slipped near the oversold zone, indicating weakening selling momentum and increasing chances of a technical rebound. Prices are testing a confluence support area comprising the 61.8% Fibonacci retracement, Bullish FVG, and 200 EMA, while remaining below the 20 and 50 EMAs.
Alternative Scenario: A break below 64,200 could extend losses towards 63,665. Conversely, a recovery above 65,470 may trigger fresh buying interest and pave the way towards 65,900.
While writing the report, BTCUSD is trading at 64900.
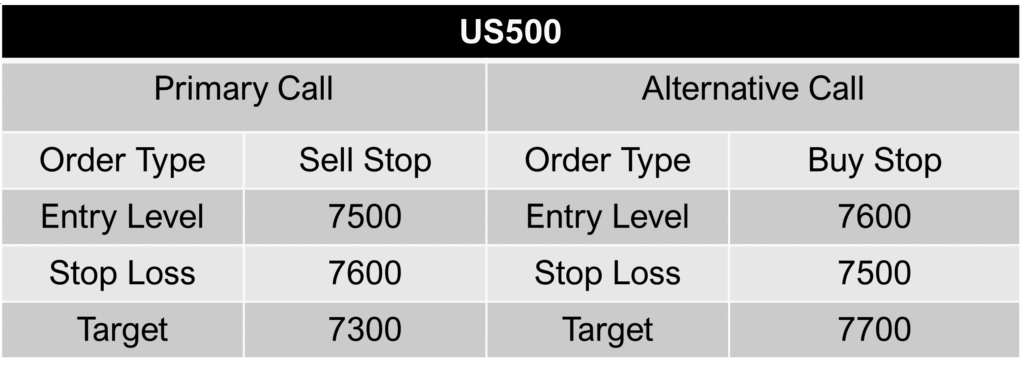
07 - US500
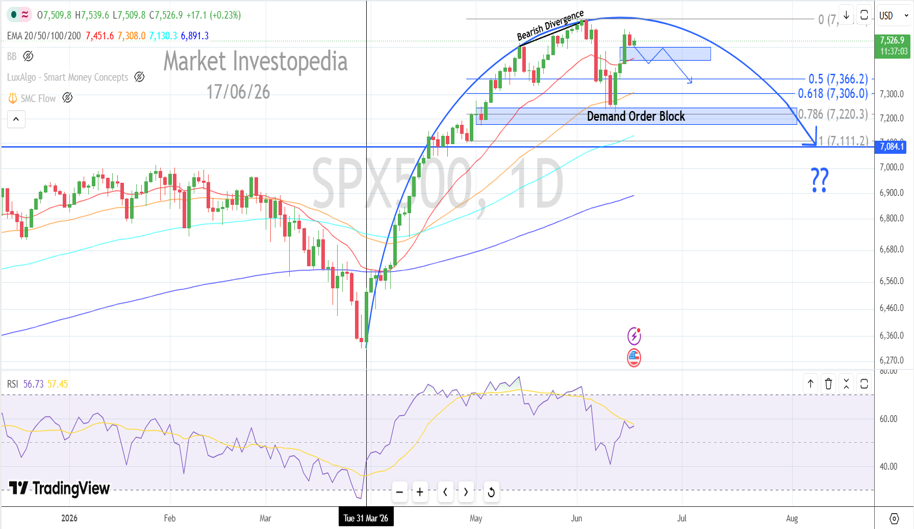
Overview: SPX500 trades near 7,527 after a strong rally from the April lows. Prices recently faced rejection near all-time highs, with a bearish RSI divergence signaling weakening momentum. Despite the pullback, the broader trend remains bullish as prices continue to trade above the 20, 50, 100 and 200 EMAs.
Biasness: Equity markets remain supported by resilient economic data, easing recession concerns, and expectations that the Federal Reserve could eventually shift towards a more accommodative stance. However, elevated valuations and uncertainty surrounding future interest rate cuts may limit further upside in the near term.
Key Levels:
S1: 7,366 S2: 7,220
R1: 7,600 R2: 7,700
Data Releases: Focus remains on the FOMC policy decision, Fed commentary, and key US economic data including Non-Farm Payrolls and CPI inflation figures. These releases could significantly influence risk sentiment and the index’s next directional move.
Technical Analysis: RSI has formed a bearish divergence against price, indicating fading bullish momentum after the recent rally. While prices remain above all major EMAs, the index is showing signs of exhaustion near record highs, increasing the likelihood of a corrective pullback towards key support zones.
Alternative Scenario: A break below 7,366 could trigger a deeper correction towards 7,220. Conversely, a sustained move above 7,600 may invalidate the bearish divergence and open the door towards fresh record highs near 7,700.
While writing the report, the pair is trending at 7529
10 - Disclaimer
- CFD trading involves substantial risk, and potential losses may exceed the initial investment.
- Signals and analysis are based on historical data, technical analysis, and market trends.
- Past performance does not guarantee future results; market conditions can change rapidly.
- Consider your risk tolerance and financial situation before engaging in CFD trading.
- Signals are for informational purposes only and not financial advice.
- Each trader is responsible for their decisions; trade at your own risk.
- The report does not consider individual financial situations or risk tolerances.
- Consult with financial professionals if uncertain about the risks involved.
- By accessing this report, you acknowledge and accept the terms of this disclaimer.
Safe trading,
Market Investopedia Ltd