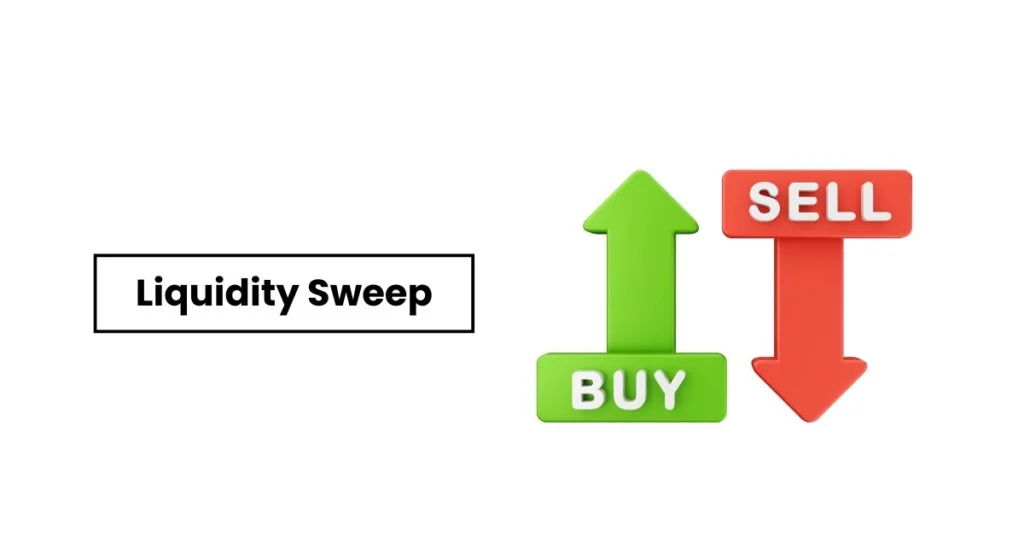
Liquidity is one of the most important concepts of the trading world. In the financial market, liquidity facilitates the ease of buying and selling an asset.
Big market participants manipulate liquidity, which directly affects the retail trades. Such scenarios are primarily defined as liquidity sweeps, and you, as a trader, need to be aware of these conditions.
Wait, you don’t know what a liquidity sweep is? Not to worry. In this blog, we will help you understand liquidity sweeps, how to identify and trade them. So stay tuned.
Introduction to Market Liquidity
Liquidity refers to the ease of opening and closing a trade in an asset at a desired price. High liquidity is when the trading volume is significant in the market that resulting in smooth trade opening and closing.
Meanwhile, low liquidity occurs when the trading volume is low that resulting in unfavorable market conditions. Traders generally prefer trading in highly liquid assets for efficient trading.
The liquidity of an asset keeps changing over time based on different factors. The big participants’ (smart money) activities are one such factor that causes a significant change in liquidity.
Major Market Players, including institutional traders, multinational corporations, and banks, engage in big trading transaction that gives volume to the market.
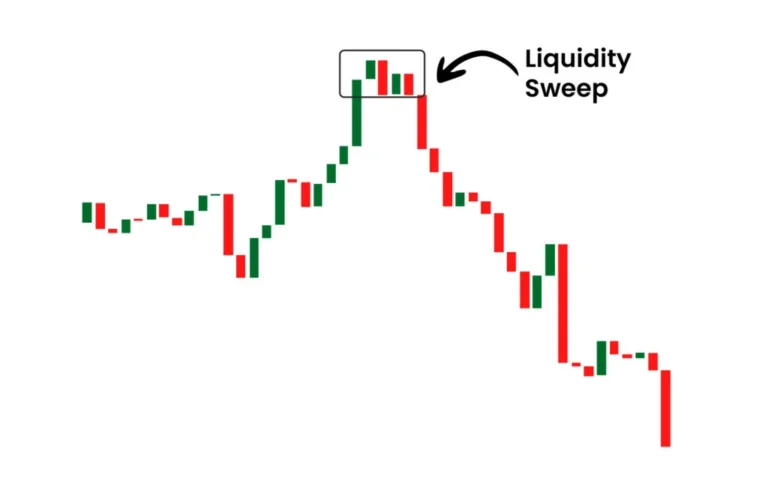
A Liquidity Sweep can be defined as a significant price movement that is caused by the activities of major market players, triggering the pending orders and stop losses of small traders.
A Liquidity Sweep can be defined as a significant price movement that is caused by the activities of major market players, which ultimately impacts the trades of retail traders.
During liquidity sweeps, the price of assets moves beyond the key support or resistance levels, triggering the pending orders and stop losses of small traders.
Predicting the market during liquidity sweeps is quite difficult. The price manipulations of market makers trap retail traders, disrupt their trades, and they even suffer losses
Example of Liquidity Sweeps in Forex
Suppose the price for XAU/USD was trending at $3340. Most traders were optimistic about the pair and set the stop loss at $3325.
Big market players’ activities negatively influenced the price of XAU/USD. As a result, the price fell to $3325, and most traders’ stop losses got triggered. The above liquidity sweep example shows how the activities of major market players impacted the small trades.
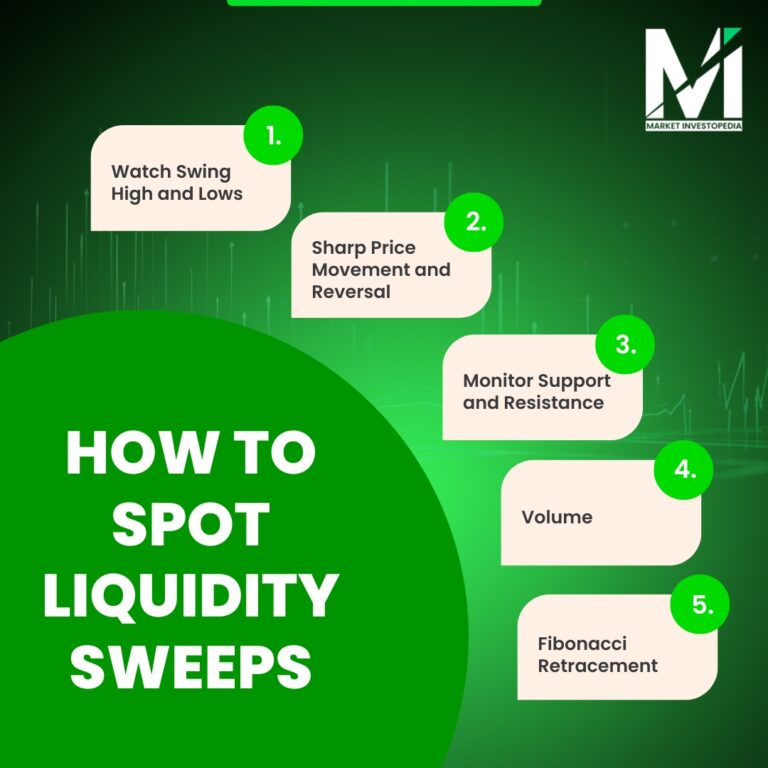
How to Spot Liquidity Sweeps
Watch Swing High and Lows:
Liquidity sweeps generally cause sudden price movements that result in the formation of new highs and lows on the chart. Traders generally set the trade entries and exits based on the highs and lows.
Sharp Price Movement and Reversal:
Watch for a sharp candle formation or a fake breakoutcaused by the liquidity. However, the price failed to sustain and then reversed again, fooling the novice traders. A sharp price rejection confirms that market makers are manipulating the price.
Monitor Support and Resistance:
Liquidity sweeps cause price moves beyond the support and resistance level. These are the zones where liquidity sweeps occur. Monitor sell-side liquidity and buy-side liquidity to identify when the price moves beyond these levels.
Volume:
Liquidity and trading volume are interrelated concepts. Liquidity sweeps accompanied by high trading activities confirm major market players’ activities.
Fibonacci Retracement:
Fibonacci retracement levels are technical analysis tools that can help traders in interpreting charts. Liquidity sweep generally occurs during the golden levels, including 61.8%. So watch these levels for liquidity trading.
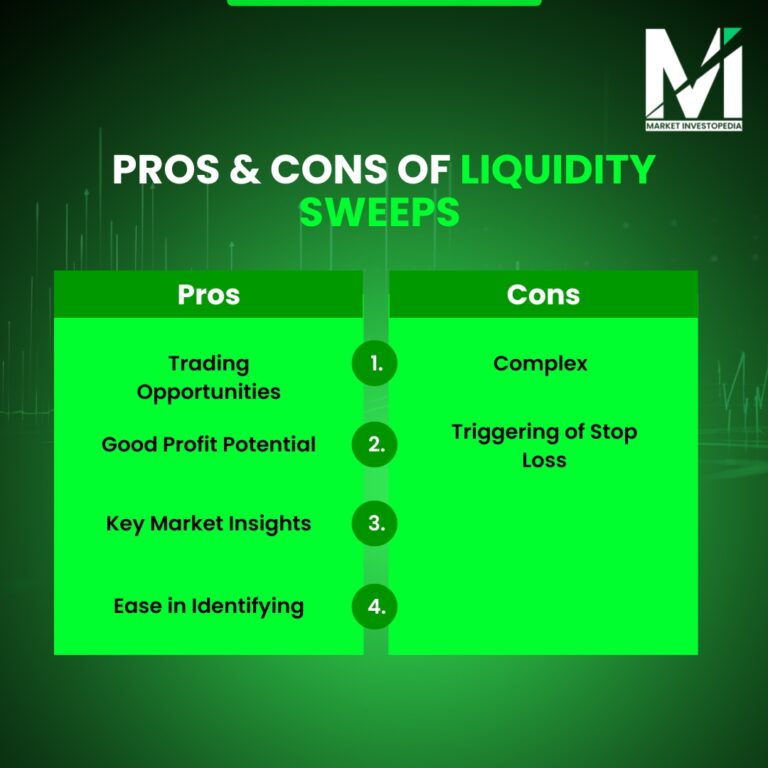
Pros of Liquidity Sweeps
Trading Opportunities:
Traders with a good understanding of smart money concepts and ICT trading principles can identify profitable trading opportunities.
Good Profit Potential:
The liquidity sweeps generally cause significant moves. So if a trader made the right prediction, then the profit amount can be big.
Key Market Insights:
Whether you’re trading liquidity sweeps or not, watching it is beneficial. You can identify key insights to market psychology, crowd sentiment, price direction, and a potential for significant moves. It basically helps you in adjusting and optimizing your trading strategy.
Ease in Identifying:
Determining a liquidity sweep is not at all a difficult task. You can use technical analysis indicators, watch charts, and fundamentals to identify it.
Cons of Liquidity Sweeps
Complex:
Beginners with a lack of knowledge of the forex market structure may struggle in trading liquidity sweeps. Also, they can experience difficulty in understanding its concepts.
Triggering of Stop Loss:
you are unable to predict the liquidity sweeps, you may end up losing trades in the wrong direction. As a result, it triggers your stop loss, and you may lose significant money.
Tips for Liquidity Sweep Trading
Keep a Watch on Major Events:
Smart money Liquidity sweeps generally occur during the release of big news, announcements, economic, and political events. Such releases give a boost to smart money activities, so watch them.
Watch Long Time Frame Charts:
When identifying liquidity sweeps, short time frame charts such as 5m, 15m, 1h, or 4h are not ideal. Long-term charts provide a comprehensive overview of the asset price. So consider monitoring Daily, Weekly, and monthly charts.
Give Importance to Confirmation:
When trading liquidity sweeps, confirmation is a must. Generally, many traders enter a trade as soon as the liquidity sweep occurs. However, confirming the strength of a sweep is a must before placing trades. Watch volume, key price, and Fibonacci levels for confirmation.
Trade During Active Hours:
Liquidity sweep generally occurs when the market is most active. Like when trading liquidity sweep in forex, considering the London and New York sessions is better. Similarly, in the stock market, the most active trading hours are ideal for trading.
Use Risk to Reward Ratio:
During the liquidity sweep, market conditions became uncertain, which is the reason why many traders avoid liquidity sweeps. However, when trading liquidity sweep, ensure that you trade with a proper risk-to-reward ratio to avoid big losses.
Watch the Smart Money Moves:
Market makers are the ones who create liquidity and cause liquidity sweeps. The best way to identify liquidity zones is to have an understanding of smart money concepts. It will help you to stand out from the crowd and track liquidity sweeps early.
Liquidity Sweep vs Liquidity Grab
Most people confuse liquidity sweep with liquidity grab, but they are not the same.
Liquidity sweeps are generally caused by the major market players’ activities. Under this price moves above or below the liquidity and then comes back again to the zone. It can happen in both directions, upward and downward. The concept of liquidity sweep is much broader than the liquidity grab.
And when it comes to liquidity grabs, it’s short-term, generally of one candle movement. It occurs because of an algorithmic move or intentional manipulations. A liquidity grab leads to a break of support or resistance, then again comes back to the key levels.
Generally, a liquidity grabs form a Dragonfly Doji or Gravestone Doji. The candle wick indicates an entrance of a lot of buyers during sell-side liquidity and the entrance of a lot of sellers during buy-side liquidity.
Wrapping Up
Liquidity Sweeps can affect the trades of retail traders, and they can even suffer significant losses due to this. However, no need to be scared of these market manipulations.
Identifying these market manipulations is quite easy. With the right knowledge, you cannot only identify them but also trade them and earn a good profit. Join Market Investopedia’s community to enhance your knowledge.